When you investigate IIS or ASP.NET errors in production, does IIS sometimes feel like a black box?
Learn to use these 4 server logs, and you will always find the error you are looking for.
Its gotta be here somewhere
Finding the error is actually fairly straightforward once you know where to look. Most of the time, the error will be in one of these 4 logfiles by default:
1. First stop: the IIS log
The website’s IIS log will contain an entry for every request to the site. This log is typically located in c:inetpublogsLogFilesW3SVC[SITEID]. For each logged request, the log includes the URL, querystring, and the response status and substatus codes that describe the error:
2013-06-16 03:39:19 ::1 GET /test.aspx mincase=80 80 - ::1 - 500 16 0 3173
Tip: Notice the 500 16 0? These are the HTTP response status code, the IIS substatus code, and the win32 error code. You can almost always map the status and substatus code to an error condition listed in IIS7 HTTP error codes. You can also look up the win32 error code via winerror.h.
Is the substatus code 0, esp. 500.0? Then its most likely an application error i.e. ASP.NET, ASP, PHP, etc.
2. Nothing in the IIS log? Check the HTTPERR log
Sometimes, the request will not listed in the IIS log. First make sure that IIS logs are enabled for the website.
In a small percentage of cases, the request may have been rejected by HTTP.SYS before it even made it to an IIS worker process. This generally happens if the request violated the HTTP protocol (client saw HTTP 400: Bad Request) or there was a WAS/the application pool failure (client saw HTTP 503: Service Unavailable).
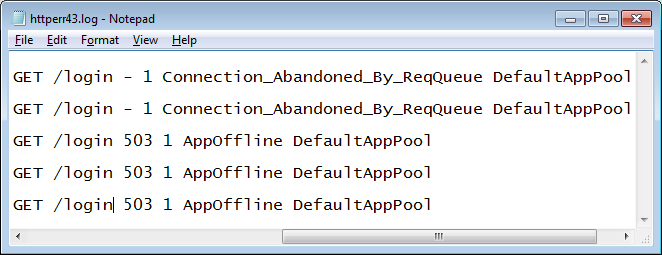
In this case, you will find the error in the HTTPERR logs, located in c:windowssystem32LogFilesHTTPERR:
2011-01-11 13:08:22 192.168.1.75 52623 192.168.1.124 2869 HTTP/1.1 NOTIFY /upnp/eventing/pfyehnxzvy - - Connection_Abandoned_By_ReqQueue
Tip: See the Connection_Abandoned_By_ReqQueue? HTTP.SYS is even better than IIS at telling you exactly why the error happened. See HTTP.SYS error codes for the exact cause.
3. ASP.NET exceptions: the Application EventLog
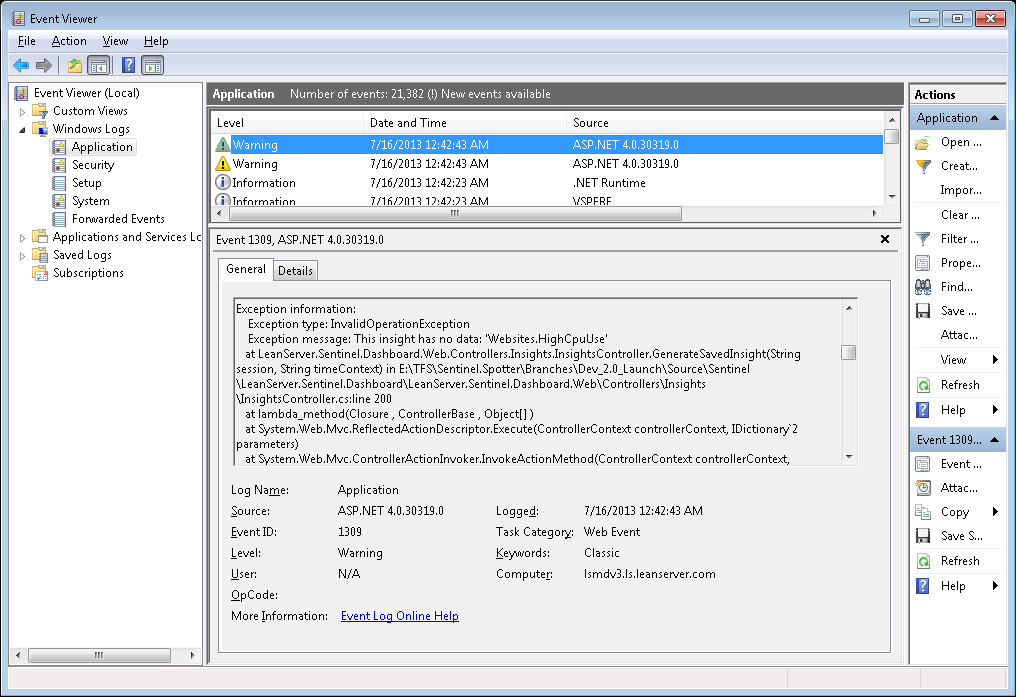
If the request is to an ASP.NET application, and the error was a 500.0, its most likely an unhandled ASP.NET exception. To find it, go to the Application EventLog and look for Warning events from the ASP.NET 4.0.30319.0 or applicable version:

Tip: ASP.NET Health Monitoring will log all errors to the Application EventLog by default. Except 404s. Also, it will only log up to 1 exception per minute. And logging is broken in ASP.NET MVC apps (sigh). Not to worry, here is a way to fix to reliably log ASP.NET exceptions.
4. Hard-to-catch errors: the Failed Request Trace (FRT) log
Can’t seem to catch the error? It it gone from the log before you can get to it? Then you need the IIS Failed Request Trace feature. This will let you configure a rule to capture a detailed request trace for a specific URL, status code, or time elapsed. Learn how to set up Failed Request Tracing to capture IIS errors.
Get ahead of the error game
If you are reacting to user error reports, you are already behind the 8-ball. The reality is, majority of production errors go unreported, because users are reluctant to speak up when they hit problems on your site. Given the short attention spans and low patience these days, they are way more likely to stop using your site instead. By the time you find out you have errors, the damage has already been done.
The only way to really win this game is to get proactive, and continually monitor all errors in your application so you can triage/fix the ones you consider important … BEFORE users begin to notice. If this sounds hard, it doesn’t have to be – esp. if you use LeanSentry’s error monitoring. Give it a try and never worry about hunting for errors again.