
A new LeanSentry OnPremise update is hot off the presses. This one has new features and a number of bugfixes for issues Continue reading LeanSentry OnPremise January Update #1
Category: New Features

Year in Review 2017
You might not know it, but 2017 has been a big year at LeanSentry.
Over the last 5 years, we’ve helped over 10,000 customers take control of production issues in their Microsoft web stack. All the while, we’ve been flying “under the radar” while working out the kinks in our product and our business model. Continue reading Year in Review 2017

Fix IIS & ASP.NET hangs faster with Hang diagnostics
Automatic hang diagnostics for IIS & ASP.NET apps has been one of LeanSentry’s most popular features.
Now, Hang diagnostics are getting even better, with more expert insight into hangs, better root cause detection, and more code-level data for your developers.
Automatically diagnose ASP.NET hangs
LeanSentry’s Hang diagnostics feature helps you resolve your website’s slowdowns, better than you can with generic monitoring tools. It does this by detecting and by automatically diagnosing dozens of common IIS, ASP.NET, and Classic ASP performance problems whenever your site experiences them.
No intrusive profilers, DebugDiag, or other tools needed. Like most of LeanSentry, hang diagnostics have virtually zero overhead during normal operation, and only a small overhead (5-10 seconds of analysis) when a problem is confirmed. This means you can add LeanSentry’s deep diagnostic insight to your existing monitoring without any conflicts or performance drops.
What’s new?
A lot! We’ve improved the diagnostic algorithms to detect more problems. Then there is the brand new diagnostic report interface that gives you better guidance, and more information on what caused the hangs.
See the actual IIS & ASP.NET operation
Expert guidance
Identify the function, slow SQL, REST call causing blocking
Try it out
If you are still troubleshooting hangs the hard way, or trying to use the generic transaction monitoring tools, you are missing out. To learn more, check out LeanSentry’s hang diagnostics, and do a trial to see it for yourself.
What do IIS hangs, slow requests, errors, and high CPU have in common?
In the last several months, we’ve worked hard to provide automatic diagnostics for most application problems on the Microsoft web platform … hangs, request queuing, errors, high CPU, and so on.
Even though LeanSentry can automatically detect and and diagnoses many of these problems, it can sometimes it can be difficult to see how they all relate … and how they impact the overall health of your web application.
NEW: Alert layers!
Alert layers uses layers of bubbles to show you all your performance problems, and how they affect your application’s health … directly on the application’s health timeline!
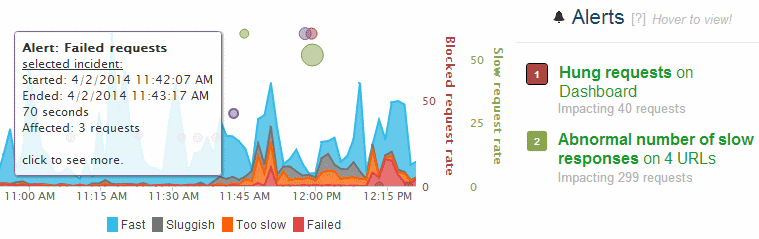
With these alert “bubbles”, you can instantly see where alerts took place, how they affected your request satisfaction in that moment, and how they related to other alerts.
This can often tell a more complete story then looking at each alert in isolation.
Usage tips:
1. Hover over any alert to show it on the graph.
2. Click the alert number to make the alert “sticky” so it does not go away when you hover over another one. Click again to hide it.
3. Hover over alert bubbles to see more information.
4. Click a bubble to go to the alert page, and diagnose it!To check this out, simply log into your dashboard and pick an application.
More good stuff coming your way!
Next, we are working on improving our alert pages so they are easier to understand, and show you the problem diagnosis right away.
Watch for big improvements here next week!
Yours,
The LeanSentry Team
New Performance page helps you track website CPU/Memory & slow requests
This week, we have another big improvement for you.
We completely remade our Performance page, and made it a lot easier to view your website performance data.
What’s there?
- Slow requests tab shows you what operations caused slow requests to your site.
- Resource use tab shows you the CPU, Memory, and Network usage by the website … compare it across all servers … and give you the diagnostic data to explain what caused the usage.
As a bonus, you can enable CPU profiling, Memory diagnostics, and slow operation tracking directly from the page.
Above all, the new interface is clean and wonderfully simple.
This is available immediately in your LeanSentry account! Just log in and go to the Performance page for any of your websites.
Don’t have an account? Get a trial account to see it for yourself.
We have more great stuff coming next week, so stay tuned!
Let’s fix production troubleshooting!

Running production web applications is a constant struggle. Slow page loads, hangs, crashes, memory leaks.
Even when you think you are clear, they come back anytime there is a code change, new feature, new server environment, or even a change in traffic.
You can have the best monitoring system in place, but when the red light goes off … YOU still have to diagnose and fix the problem.
Conveniently, that’s where your monitoring tool politely bows out and lets you do the hard work.
And where many IT and devops teams end up spending most of their time.
At LeanSentry, we set out to fix the production troubleshooting process.
To do it, we had to solve the problem of both tools AND expertise.
Tools. The tools we use fall into two categories: production monitoring tools (perfmon, logparser, SCOM, third parties), and developer analysis tools (debuggers, profilers). The monitoring tools detect but cant diagnose problems. When you finally bring in the heavy developer tools to solve the problem, its already long gone. You can’t profile a process that doesn’t have high CPU anymore … or debug a hang that’s no longer there. The alternative: to run your process under 24/7 profiling and debugger in anticipation of possible problems is just not acceptable.
Expertise. Even if you somehow got all the data, making sense of it can be very difficult. If you’ve ever done a production hang or memory leak investigation, you know exactly how much work and time it takes to get to the bottom of things.
Of course, you could go out and hire an troubleshooting expert. Get security access for them. Spend hours explaining your application to them. Pay them a lot of money. Then, they’ll set up the same debugging tools on your server, wait for the issue to reproduce, and maybe get you the answer several weeks later.
We’ve been doing this kind of troubleshooting for years.
But to make it accessible to everyone who runs Microsoft web apps, we needed to do it automatically, with low overhead, and without requiring the user to be an IIS expert.
Here was our blueprint:
- Lightweight 24/7 monitoring to always catch problems the first time. We use performance counters, IIS logs, and ETW events to watch for problems. These protocols have near-zero overhead on the server, and cannot affect the application because they completely external.
- Automatically detect problems like hangs or memory leaks. These are the tricks of the trade: rules based on Microsoft guidelines and our own troubleshooting techniques. Our hang diagnostic uses over 12 different rules to reliably detect a hang given various pieces of lightweight monitoring data.
- Automatically analyze the problem so you don’t have to. When the problem is detected, we’ll analyze it immediately and attempt to determine the root cause. This also works to eliminate the knowledge gap: software can do the complex analysis and present the facts simply so that operations teams can easily act or transition the resolution to the developer.To do the analysis, we can leverage multiple data sources at our disposal: including IIS logs, ETW events, profiling data, and sometimes the debugger. We’ve been doing this kind of troubleshooting for years, so this was just a matter of automating it.Best of all, this analysis has low impact because a) it only takes place when there is already a problem and b) usually lasts just a few seconds and always keeps the application running.
- Alert you about the problem, and show you the solution. This is the best part. Instead of having to spend days hunting and analyzing the problem, you get a shrink-wrapped report with a pretty bow on it (bow not included). This is the difference between taking weeks to diagnose a problem every time, or literally minutes.
LeanSentry can now diagnose: website hangs, ASP.NET memory leaks, IIS application pool crashes, and more
Getting these kind of diagnostics to work right for everyone takes time. We are now 7 months after our launch in February, and here are the kinds of things we can diagnose:
- Hangs and slow page loads. We’ll detect IIS website hangs or very slow page loads, and tell you when you have concurrency misconfiguration problems or thread pool exhaustion. Down to the line of code thats causing the hang.
 Learn more about the hang diagnostic →
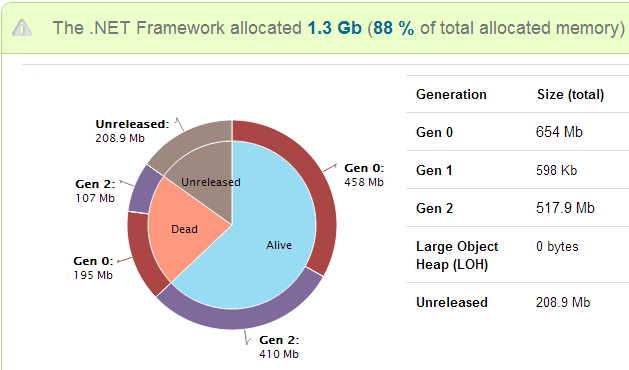
 - ASP.NET memory leaks. We’ll detect memory leaks and out of memory problems, and give you a complete memory analysis to tell you what caused it.
 Learn more about the ASP.NET memory leak diagnostic →
 - IIS and ASP.NET errors, IIS application pool crashes and recycles, and more.
There is too many to list here, but you can see many of them in action in our demo application.
Our ultimate goal was to change the way people deal with application problems in production.
To break the monitor -> struggle -> reproduce -> investigate cycle.
It looks like we are finally doing it. To check out our new diagnostics and how they work, go to www.leansentry.com. While there, set up a free trial account and never look back.
Search your entire IIS/ASP.NET web application stack

LeanSentry tracks all the important things that make up your Windows web application environment … including processes, Windows services, ASP.NET websites, IIS application pools, URLs, errors, etc.
Now, you can instantly find and get data for all of them!
Say what?
Under the covers, LeanSentry builds a graph containing all the objects its seeing in your application. For example, your environment contains servers, the servers contain processes, websites, and so on. Each website contains URLs we are extracting from your logs. URLs are associated with errors we are seeing in your application. With the new search, you can quickly browse and find any of these.
But, it gets better. LeanSentry collects a lot of metrics from your environment (e.g. performance counters), and calculates other metrics (e.g. request latency, error rates, and so on). It also generates insights (e.g. analyzing an error for abnormal behavior) and alerts (e.g. application pool crashed). You can now find and show all this data when you search your environment.
For example, you can:
1. Break down the processes by their memory usage across all your servers. Then, drill into a specific process on a specific server, and break it down by its memory usage vs. others on the server. Then see when the process was launched, by who, and what the path/command line was.
2. Search for a specific error across all your websites. Select a specific instance, show its history over time, and view its occurrences.
3. Search for a specific website, see all URLs in it broken by latency, and see what its throughput was over time.
You can answer a dozen questions like this in minutes and see all the data you found side by side.
This is how it works:
1. You can open the “search” interface by clicking the Search icon at the bottom of any page. This will open the search page, and focus it on the website, server, URL, or error that you were looking at. This way, you are always first looking at the very thing you wanted to learn more about.

2. LeanSentry will show you all the data available in the current context. Simply type to instantly filter down to the thing you want … or press enter to do a “deep search” which will search the entire data graph.
3. Click any of the data items to show it! You can quickly switch back and forth between all the objects you’ve looked at, and grab data from all of them as needed to tell the story.

With this feature, you can explore your environment, and quickly get rich information to support your investigations or performance tuning. We’ll save your search, so you can use it to create custom reports about a problem and then share it with your team.
The best part? As we add more alerts, more diagnostics, and more insights, they will immediately become available to you even if they are not yet part of the dashboard. We are making this feature a part of our Core plan so everyone using LeanSentry has access to it effective immediately 🙂
We’ve been kicking ass, and its showing. Be sure to come by our booth at TechEd 2013 next week, and see all these new features live!
If you haven’t yet, sign up for the trial and start using LeanSentry to support your IIS/ASP.NET apps like a boss.
Best,
The LeanSentry Team

The holy grail: Automatically diagnose IIS & ASP.NET website hangs
It’s your peak traffic hour, and your website is not loading. Requests are timing out, and recycling the application pool isn’t helping this time.
We’ve all been there, and it’s a nightmare even for a seasoned IIS/ASP.NET pro.
Website hangs are an unfortunate but common reality for web applications. To make things worse, even the latest and greatest performance monitoring products don’t help. After 10 years in this business, we don’t know a single commercial or MSFT tool that can figure out what causes a hang in an IIS / ASP.NET application (more on why later). So, this is where the seasoned pro reaches for the hardcore tools, the WinDbg debugger or Debug Diagnostics … and mentally prepares to spend hours digging around.
That is, if they are are lucky enough to catch the problem live on a machine with the debugger installed.
And what if you don’t make a living debugging IIS? Call Microsoft support and get ready to spend 15 hours on the phone before you can get someone who even knows what a w3wp dump is. We’ve had difficult hangs take 2 months to resolve, between catching and collecting proper evidence for a hang in production, and waiting for MSFT support to escalate to an engineer that knows what they are doing.
It’s no wonder that it took us this long to finally tackle this scenario with LeanSentry. There are just so many things that can go wrong: hanging SQL or web service calls, application deadlocks, thread pool exhaustion (in both the IIS and CLR threadpools), CPU overload, the list just goes on. Most of the time, many of these things cascade together to cause the hang.
That said, we finally did it.
LeanSentry is now the only monitoring tool available that automatically troubleshoots IIS/ASP.NET hangs.
This is how it works:
1. Your website encounters a hang for one out of dozen possible reasons.
2. LeanSentry automatically detects the hang, performs a realtime diagnostic test, and sends you an alert that tells you exactly what caused the hang.
This makes sure that we capture the hang no matter when, how rarely, or on what server the hang happened. LeanSentry then tries to cut through the complexity of the hang analysis, and explain what happened in plain language so you can quickly understand and take action to resolve it.
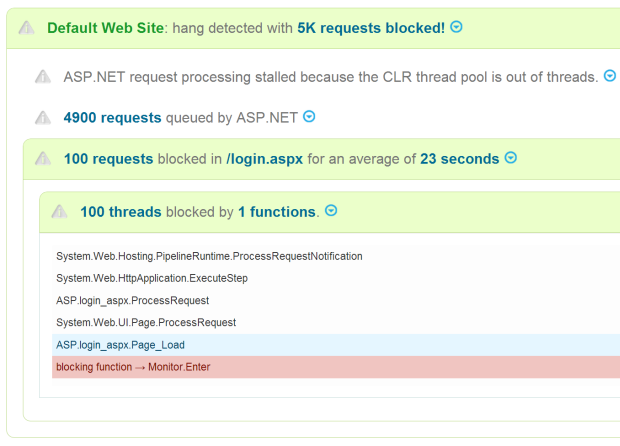
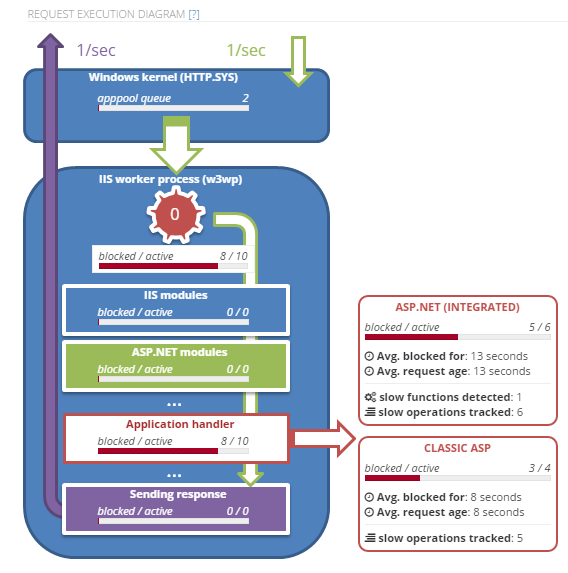
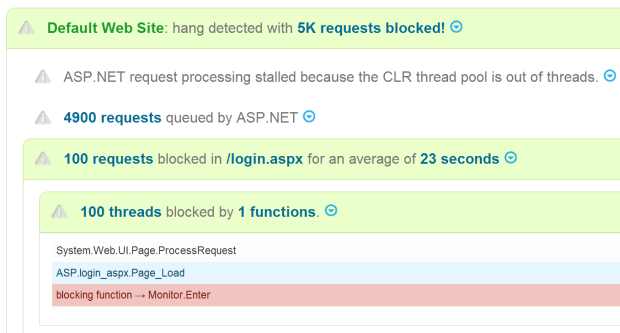
LeanSentry breaks down a hang simply: ASP.NET fell behind in request processing with 4900 requests in the queue, because it ran out of threads in the CLR threadpool. The 100 threads available were blocked waiting for the 100 requests that got stuck in Page_Load() in login.aspx.
Sounds too good to be true, right? We thought so too when we finally got it to work. Here is what happens in more detail:
1. Realtime hang detection without debuggers. LeanSentry continuously monitors each application pool for signs of hangs, to make sure that we catch it whenever it happens. This is done using LeanSentry’s standard lightweight monitoring, which has virtually 0 impact on your production systems, unlike running your applications with a debugger or profiler attached. This also means it can even be done remotely without installing anything on your actual production servers.
When detecting a hang, we take into account the application pool’s specific IIS/ASP.NET threading settings that affect request processing, as well as many other known symptoms of hangs. For example, Max Queued Item Age of the application pool queue stably increasing for over 30 seconds. We can’t trust all signs though, so we look at multiple signs together and pick those that most likely indicate hangs or serious perf degradation.
2. Confirm the hang. When a hang is suspected, LeanSentry will snapshot currently executing requests and identify which requests appear queued, or blocked. For example, blocked requests have been executing in the same place for over 10 seconds. Queued requests are hard to identify and require us to use a bunch of heuristics.
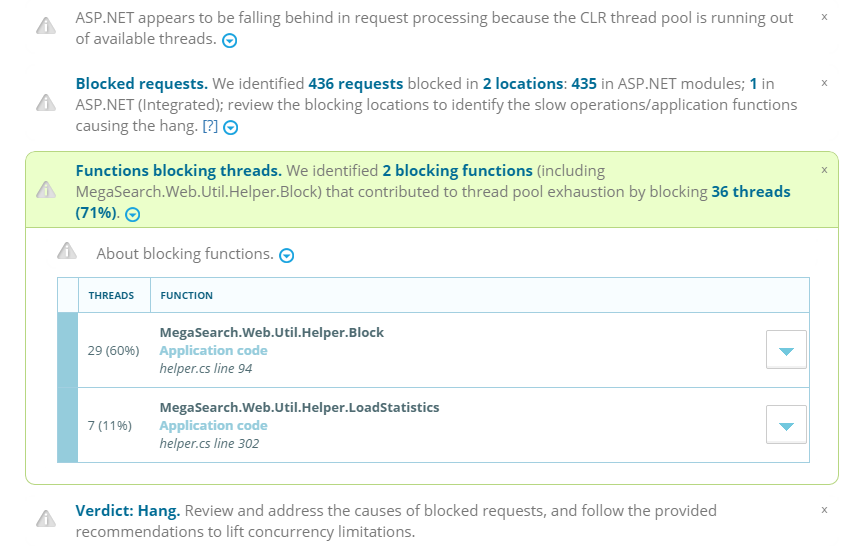
3. Determine application functions that are causing blocking. If the executing requests confirm the hang, the LeanSentry Agent will perform a differential thread snapshot of the process, which will determine where threads are stuck in your application code.
4. Diagnose thread pool exhaustion. Finally, we will analyze threading and queueing characteristics of the application pool across the HTTP.SYS kernel queue, IIS, and ASP.NET, and figure out where exhaustion is taking place.
5. Generate the alert. The “Website had hung requests” alert will be generated, you’ll get an email, and can view the alert page for a step-by-step hang diagnosis.
Why aren’t there any other commercial tools that diagnose IIS/ASP.NET hangs?
Because its very hard to do. Don’t believe me? Try to follow the explanation of how ASP.NET thread pool behaves between Integrated and Classic mode across .NET 3.5. 3.5 SP1, and 4.0. It will make your brain sad. To make things even worse, recent versions of ASP.NET broke a lot of the more obscure but documented queueing functionality (MaxConcurrentRequestsPerCPU = 0 no longer works by default, and the “ASP.NET ApplicationsRequests Executing” counter erroneously shows “total requests served” instead). This shows that even the product teams at Microsoft are not closely following this area of the platform.
The only MSFT tool that even tries to diagnose hangs is the Debug Diagnostics tool, which is not suitable for continuous production monitoring and only diagnoses a small subset of issues that cause hangs. The tool itself is showing its age, having been built internally in Microsoft for pre-.NET applications and only recently adding very partial support for .NET. In most of today’s applications, hangs involve .NET applications and the .NET CLR thread pool.
Third party profiler-based APM tools that support the Microsoft platform, like New Relic or AppDynamics, lack the Windows and IIS-specific intelligence needed to diagnose these problems. They may help you pinpoint slow code (but usually not during a hang because requests never complete), but will not be able to understand what happens under the covers of IIS/ASP.NET runtimes that triggers the hang. These tools also come with the overhead of running your production applications under a profiler, which has a heavier overhead than most people are willing to allow.
Getting it done
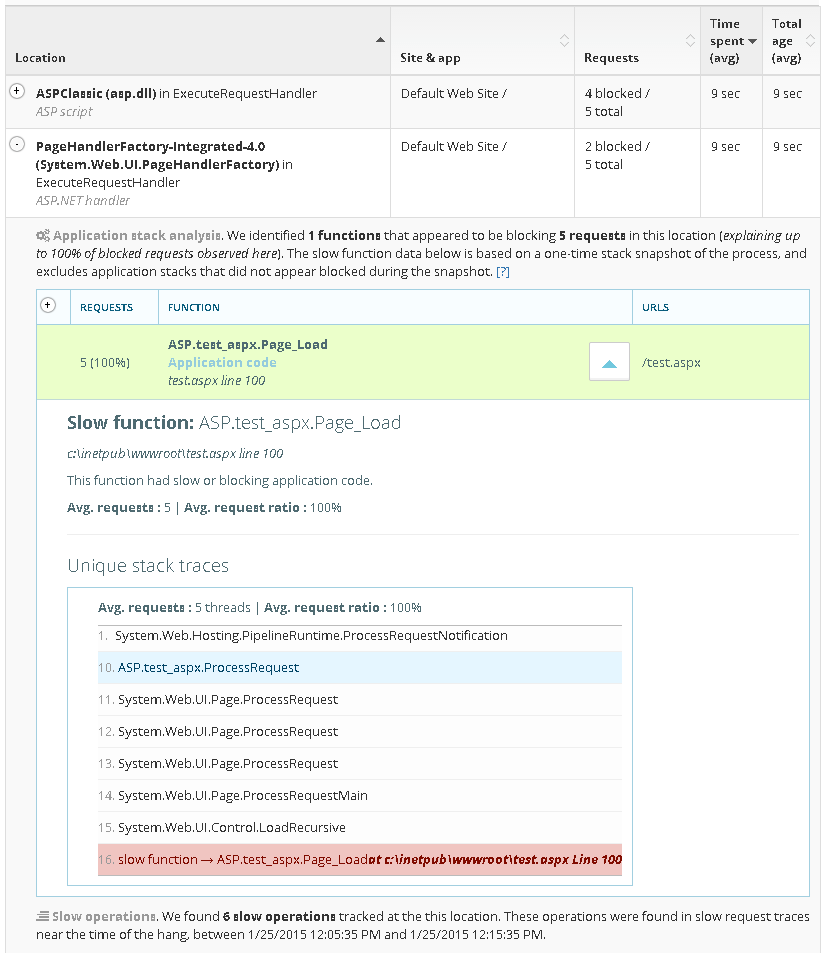
The step-by-step Hang diagnosis will walk you through the hang as it happened, showing you where requests are blocked up to the application function, and even the HTTP request or SQL query it was making.
The diagnosis will also determine if IIS/ASP.NET threading configurations are causing the problem, and recommend adjustments for the workload.
Keep in mind, because LeanSentry performs hang detection and diagnosis in realtime, you can watch how changes in your configuration and code cause hang-type problems over time, and get up-to-date recommendations on how to avoid them. This is very different from hiring an IIS expert or Microsoft to diagnose a hang for you, because you’ll at best get the resolution for the point in time problem – which may or may not help you the next time.
The automatic hang diagnostics is one of the best examples of how LeanSentry improves your experience of running Microsoft web apps, by combining lightweight 24×7 monitoring with expert analysis based on 10 years of solving these problems for hundreds of companies. You need both: to catch the problem in production, and to make sure you can make heads or tails of it later.
Think of LeanSentry as your resident IIS expert – one that never sleeps, and costs pennies compared to what it costs to hire comparable experts from the outside. If you haven’t tried it already, sign up for the trial, and take control over hangs and other production problems with LeanSentry’s automated production diagnostics.
Manage your IIS/ASP.NET web apps better with smart alerts
LeanSentry’s mission is to make you an expert on the Microsoft web stack … and help you catch & solve everyday application problems without spending hours troubleshooting. Last month, we worked hard to roll out several new features that do exactly that!
If you are running web applications on the Microsoft web platform, definitely give LeanSentry a try. Check out the live demo and try it free in your app.
Here are some of the new things you get:
1. Smarter alerts (like you’ve always wanted!)
Most monitoring tools have alerts to notify you when problems happen, so you can respond and fix them. Unfortunately, most tools we’ve used have the same challenges when it comes to alerts: they make you work to create custom alert thresholds, then swarm you with alerts for things you don’t care about, or worse yet, miss important problems. The signal to noise ratio is so hard to get right, and causes alerts to lose their value and just get ignored.
So, we built a better alert system: one that acts more like a human performance expert that you hired to watch your servers and apps for you. This expert respects your time and only tells you about things it knows are important to you.

Each LeanSentry alert is custom designed by us to highlight an interesting condition, such as a server being overloaded to a point of bad performance. Each alert also automatically determines whether its important enough to be sent to you. For example, a High CPU alert will only be important if happens on a server you consider important, or if the CPU usage is statistically abnormal high given prior history on that server. High CPU by itself is not considered important if the server usually exhibits that behavior (we run our system in the cloud, and we are happy when our cloud instances are well utilized as long as they dont perform poorly).
This way, while you can easily see and diagnose all High CPU alerts in the dashboard, you will only get an email whenever a High CPU alert really demands your attention.
When you log into the dashboard to view an alert, we’ll show you its entire history across all the affected servers/urls/etc. Then, we’ll automatically identify the root causes of the problem, (e.g. identifying the errors for failed requests on a URL, or the specific processes, services, websites, and even functions that consumed CPU for the High CPU alert):

With 1 email and 3 clicks, you’ll see only the alerts you care about, get the entire picture, and identify the exact root causes. Done!
2. Important errors, automatically identified.
Most apps have a lot of errors. Some errors happen a lot (404 on favico.ico), but are not really interesting. Other errors happen rarely, but are very interesting (IIS worker process crash). Its very time consuming to wade through all the errors in the app to find the ones that are important enough to investigate.
LeanSentry now will automatically flag errors you should take a look at, in a daily email report as well as whenever you look at the error page. Flagged errors include spiking errors, errors that are new for the application or on a specific URL, errors that have high impact, and so on:

3. Server groups, and server overload diagnostics.
LeanSentry now allows you track server performance as a group, and quickly diagnose server overload that leads to bad performance.
When you click a server, you can see a detailed breakdown of all its resources (CPU, RAM, Disk, Network), and whether the server is bottlenecking on any of them:


Then, select a resource and we’ll tell you exactly who caused the overload – including your processes, services, and websites on your server.
And more good stuff
If that wasnt enough, we also released a number of other things that make your job easier:
- Multiple user accounts and sharing. Create accounts for your team members and share links for guest access.
- Better URL folding. Automatically group URLs into meaningful groups.
- ASP error support. Expose detailed error messages (with line numbers) for Classic ASP errors.
If you are running ASP.NET or any web application on IIS, you gotta start using LeanSentry! You’ll be amazed with how much time you’ll save, how much insight you’ll gain, and how much easier it will be to keep your web applications running.
Also, right now is a great time to become an early adopter. Whenever you want, you can chat directly with the founders and the development team, and give us feedback that might just end up in the next build.
To get started, check out the live demo and set up LeanSentry out in your apps now (it only takes a few minutes)!
Best,
The LeanSentry Team