
It’s your peak traffic hour, and your website is not loading. Requests are timing out, and recycling the application pool isn’t helping this time.
We’ve all been there, and it’s a nightmare even for a seasoned IIS/ASP.NET pro.
Website hangs are an unfortunate but common reality for web applications. To make things worse, even the latest and greatest performance monitoring products don’t help. After 10 years in this business, we don’t know a single commercial or MSFT tool that can figure out what causes a hang in an IIS / ASP.NET application (more on why later). So, this is where the seasoned pro reaches for the hardcore tools, the WinDbg debugger or Debug Diagnostics … and mentally prepares to spend hours digging around.
That is, if they are are lucky enough to catch the problem live on a machine with the debugger installed.
And what if you don’t make a living debugging IIS? Call Microsoft support and get ready to spend 15 hours on the phone before you can get someone who even knows what a w3wp dump is. We’ve had difficult hangs take 2 months to resolve, between catching and collecting proper evidence for a hang in production, and waiting for MSFT support to escalate to an engineer that knows what they are doing.
It’s no wonder that it took us this long to finally tackle this scenario with LeanSentry. There are just so many things that can go wrong: hanging SQL or web service calls, application deadlocks, thread pool exhaustion (in both the IIS and CLR threadpools), CPU overload, the list just goes on. Most of the time, many of these things cascade together to cause the hang.
That said, we finally did it.
LeanSentry is now the only monitoring tool available that automatically troubleshoots IIS/ASP.NET hangs.
This is how it works:
1. Your website encounters a hang for one out of dozen possible reasons.
2. LeanSentry automatically detects the hang, performs a realtime diagnostic test, and sends you an alert that tells you exactly what caused the hang.
This makes sure that we capture the hang no matter when, how rarely, or on what server the hang happened. LeanSentry then tries to cut through the complexity of the hang analysis, and explain what happened in plain language so you can quickly understand and take action to resolve it.
Sounds too good to be true, right? We thought so too when we finally got it to work. Here is what happens in more detail:
1. Realtime hang detection without debuggers. LeanSentry continuously monitors each application pool for signs of hangs, to make sure that we catch it whenever it happens. This is done using LeanSentry’s standard lightweight monitoring, which has virtually 0 impact on your production systems, unlike running your applications with a debugger or profiler attached. This also means it can even be done remotely without installing anything on your actual production servers.
When detecting a hang, we take into account the application pool’s specific IIS/ASP.NET threading settings that affect request processing, as well as many other known symptoms of hangs. For example, Max Queued Item Age of the application pool queue stably increasing for over 30 seconds. We can’t trust all signs though, so we look at multiple signs together and pick those that most likely indicate hangs or serious perf degradation.
2. Confirm the hang. When a hang is suspected, LeanSentry will snapshot currently executing requests and identify which requests appear queued, or blocked. For example, blocked requests have been executing in the same place for over 10 seconds. Queued requests are hard to identify and require us to use a bunch of heuristics.
3. Determine application functions that are causing blocking. If the executing requests confirm the hang, the LeanSentry Agent will perform a differential thread snapshot of the process, which will determine where threads are stuck in your application code.
4. Diagnose thread pool exhaustion. Finally, we will analyze threading and queueing characteristics of the application pool across the HTTP.SYS kernel queue, IIS, and ASP.NET, and figure out where exhaustion is taking place.
5. Generate the alert. The “Website had hung requests” alert will be generated, you’ll get an email, and can view the alert page for a step-by-step hang diagnosis.
Why aren’t there any other commercial tools that diagnose IIS/ASP.NET hangs?
Because its very hard to do. Don’t believe me? Try to follow the explanation of how ASP.NET thread pool behaves between Integrated and Classic mode across .NET 3.5. 3.5 SP1, and 4.0. It will make your brain sad. To make things even worse, recent versions of ASP.NET broke a lot of the more obscure but documented queueing functionality (MaxConcurrentRequestsPerCPU = 0 no longer works by default, and the “ASP.NET ApplicationsRequests Executing” counter erroneously shows “total requests served” instead). This shows that even the product teams at Microsoft are not closely following this area of the platform.
The only MSFT tool that even tries to diagnose hangs is the Debug Diagnostics tool, which is not suitable for continuous production monitoring and only diagnoses a small subset of issues that cause hangs. The tool itself is showing its age, having been built internally in Microsoft for pre-.NET applications and only recently adding very partial support for .NET. In most of today’s applications, hangs involve .NET applications and the .NET CLR thread pool.
Third party profiler-based APM tools that support the Microsoft platform, like New Relic or AppDynamics, lack the Windows and IIS-specific intelligence needed to diagnose these problems. They may help you pinpoint slow code (but usually not during a hang because requests never complete), but will not be able to understand what happens under the covers of IIS/ASP.NET runtimes that triggers the hang. These tools also come with the overhead of running your production applications under a profiler, which has a heavier overhead than most people are willing to allow.
Getting it done
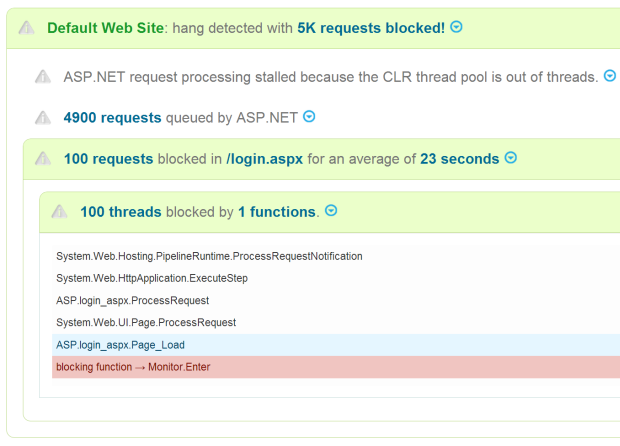
The step-by-step Hang diagnosis will walk you through the hang as it happened, showing you where requests are blocked up to the application function, and even the HTTP request or SQL query it was making.
The diagnosis will also determine if IIS/ASP.NET threading configurations are causing the problem, and recommend adjustments for the workload.
Keep in mind, because LeanSentry performs hang detection and diagnosis in realtime, you can watch how changes in your configuration and code cause hang-type problems over time, and get up-to-date recommendations on how to avoid them. This is very different from hiring an IIS expert or Microsoft to diagnose a hang for you, because you’ll at best get the resolution for the point in time problem – which may or may not help you the next time.
The automatic hang diagnostics is one of the best examples of how LeanSentry improves your experience of running Microsoft web apps, by combining lightweight 24×7 monitoring with expert analysis based on 10 years of solving these problems for hundreds of companies. You need both: to catch the problem in production, and to make sure you can make heads or tails of it later.
Think of LeanSentry as your resident IIS expert – one that never sleeps, and costs pennies compared to what it costs to hire comparable experts from the outside. If you haven’t tried it already, sign up for the trial, and take control over hangs and other production problems with LeanSentry’s automated production diagnostics.