Tasks are simple, step-by-step wizards to help you fixing ASP.NET problems.
Our users wanted a simpler way to solve common problems without finding them in the LeanSentry dashboard. And that’s exactly what we built.
Here is a video of using the “Fix slow requests” troubleshooting task to quickly troubleshoot slow page loads:
This also leverages the new slow operation tracking feature we announced last week, which tells you what causes your slow requests by tracking the operations that slow them down.
We already have tasks for:
Fix your top errors
Troubleshoot slow requests
More tasks are coming over the next couple weeks. Do you have a suggestion for a task you’d like to see? Let us know!
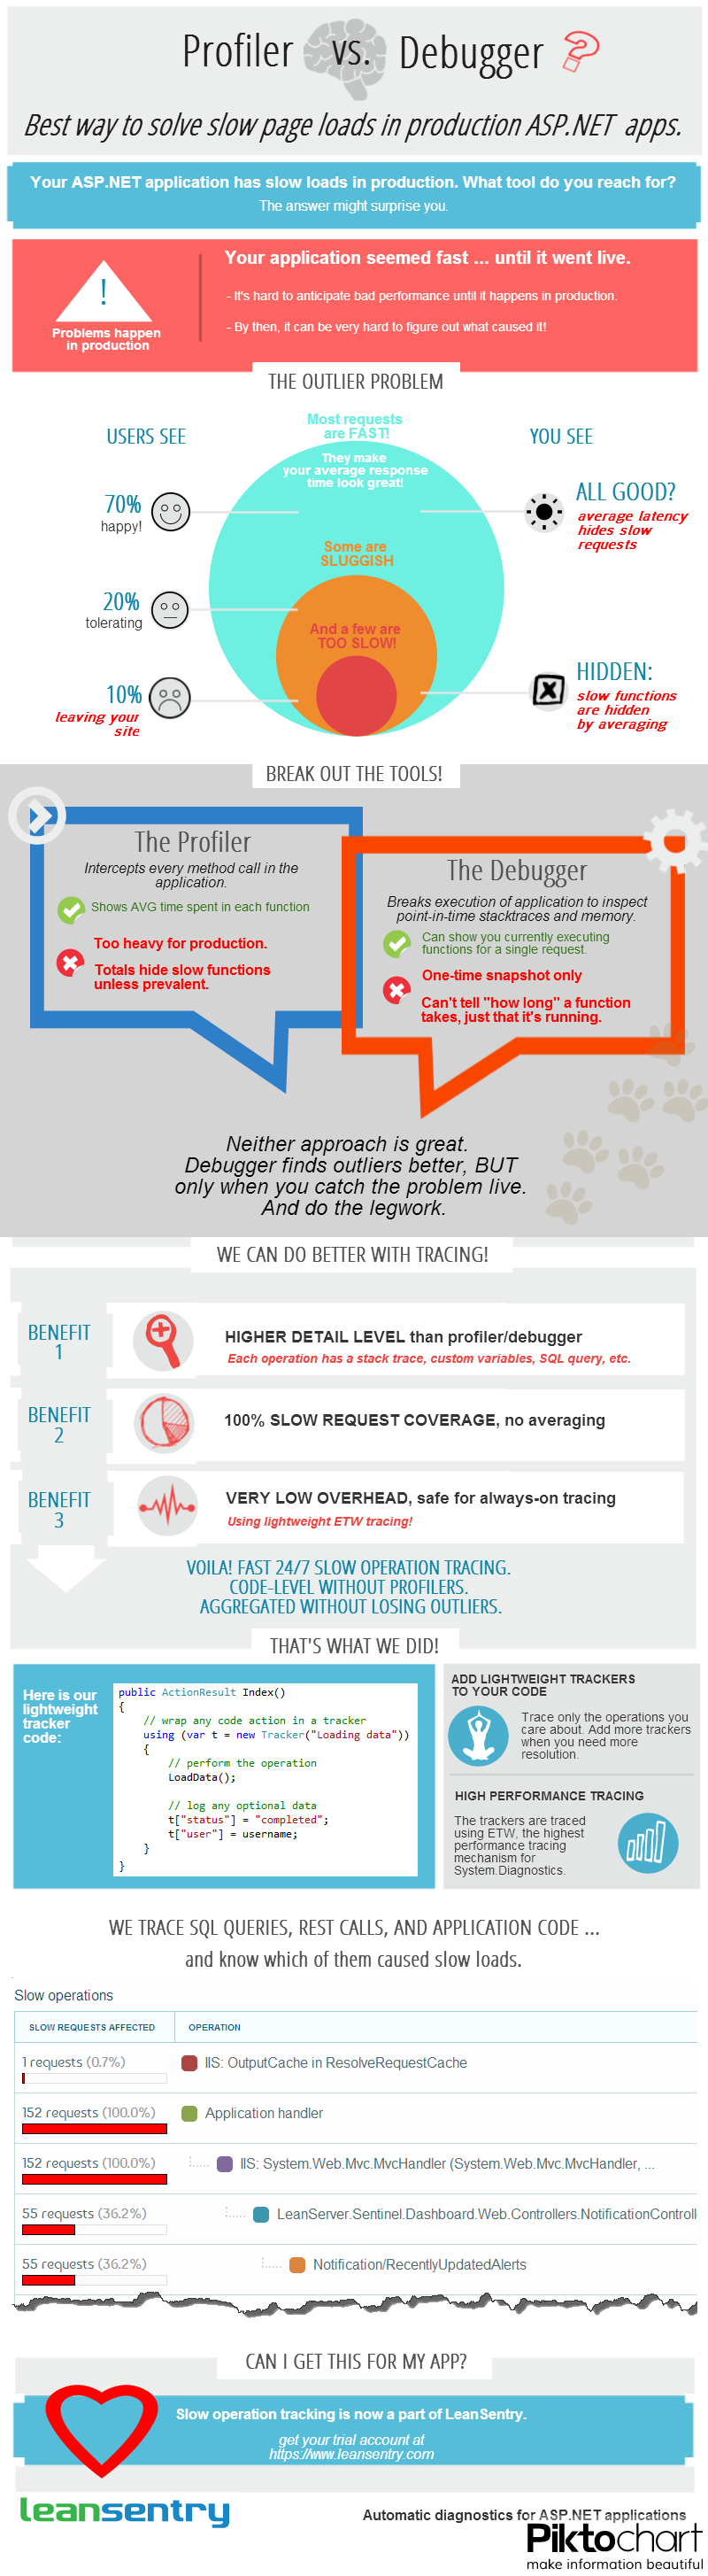
Got slow ASP.NET page loads in your application? Should you use the a profiler or a debugger to troubleshoot them?
We put together an infographic to help you decide.
It also mentions a third approach using ETW tracing, which is what we used for LeanSentry’s new slow operation tracking feature … and the benefits it has over traditional debuggers or profilers.
Using high-speed ETW tracing for 100% slow operation coverage
We just announced our new slow operation tracking feature, which uses ETW tracing to give a complete coverage of slow operations. It combines a lightweight tracing library, intelligent filtering, and very fast ETW tracing, and an awesome report in the LeanSentry dashboard.
The result: a much better way to track what causes slow page loads in ASP.NET applications than the traditional profiling or debugging approach.
Unlike a profiler, we can trace every single slow operation, as well as its stacktrace and custom application variables, without losing it to averaging.
Unlike a debugger, we can get continuous coverage of all your requests, not just the ones you happened to catch when you were debugging.
Unlike both, its fast enough for 24/7 monitoring in production and gives 100% coverage of all your slow requests.
If you think “OMG that must be so slow” when you hear tracing, think again. ETW tracing is pretty much on all the time in your applications, and is tons faster then any other custom-built tracing mechanism you may already have going on. In fact, most apps can turn on ETW tracing and probably never realize its there.
Most importantly, you decide which operations to trace! You can add more or fewer trackers to your code to get more resolution.
Of course, LeanSentry does some extra stuff under the covers to make the most of this. We know what makes a request slow (you configure per-URL response time thresholds), automatically determine which operations are slow so we don’t trace everything, and provide a near-realtime report to you.
More resources
Learn more about LeanSentry’s new operation tracking feature – based on the ETW tracing approach the infographic mentions. Check out the demo video here!
This week, we are launching new services that deliver oodles more value for LeanSentry users.
Our alerts service went live today, and is enabled for all new user accounts.
LeanSentry alerts are a much improved version of IT alerts in traditional monitoring products:
– They are specific, e.g. they tell you exactly what happened and where – like URL “/Profile” had 34 requests fail with error “NullReferenceException”.
– They quickly show you whether the problem is global to your entire application, or local to a place like a server
– They are measurable, showing you how much time or number of requests affected
But best of all … LeanSentry automatically diagnoses alerts to highlight the root causes of problems!
We use all the wonderful data we collect as well as our expert troubleshooting patterns to tell you what the exact problem is. We have automated diagnoses for top problems like high CPU, low memory, and errors, and are adding many more as this month goes on.
LeanSentry now has a brand new scalable architecture, built on Windows Azure cloud. We moved away from the traditional database-based backend to something that is more suitable for the high volume of data LeanSentry captures, and the user growth we expect (and hope!) to see over the next few months.
The new backend leverages all the same cloud best practices we’ve been using for our clients over the last year. As they say, it was high time to eat our own dogfood!
Mike will be blogging about the details of the architecture on his blog later when things calm down.
For now, we are super pumped for the snappy page loads and better data analysis performance.