Automatic hang diagnostics for IIS & ASP.NET apps has been one of LeanSentry’s most popular features.
Now, Hang diagnostics are getting even better, with more expert insight into hangs, better root cause detection, and more code-level data for your developers.
Automatically diagnose ASP.NET hangs
LeanSentry’s Hang diagnostics feature helps you resolve your website’s slowdowns, better than you can with generic monitoring tools. It does this by detecting and by automatically diagnosing dozens of common IIS, ASP.NET, and Classic ASP performance problems whenever your site experiences them.
No intrusive profilers, DebugDiag, or other tools needed. Like most of LeanSentry, hang diagnostics have virtually zero overhead during normal operation, and only a small overhead (5-10 seconds of analysis) when a problem is confirmed. This means you can add LeanSentry’s deep diagnostic insight to your existing monitoring without any conflicts or performance drops.
What’s new?
A lot! We’ve improved the diagnostic algorithms to detect more problems. Then there is the brand new diagnostic report interface that gives you better guidance, and more information on what caused the hangs.
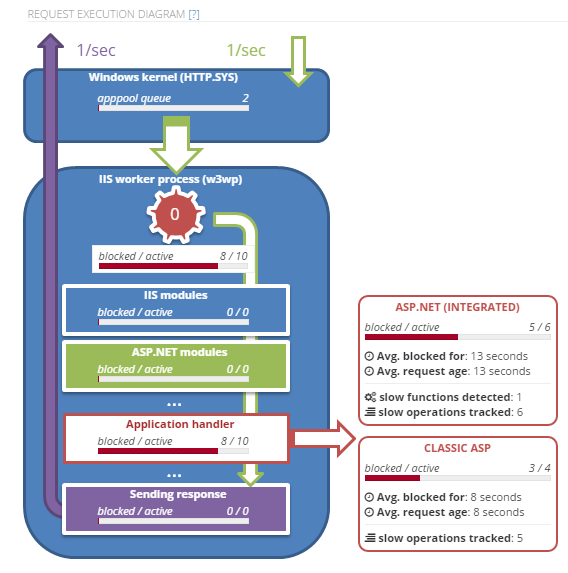
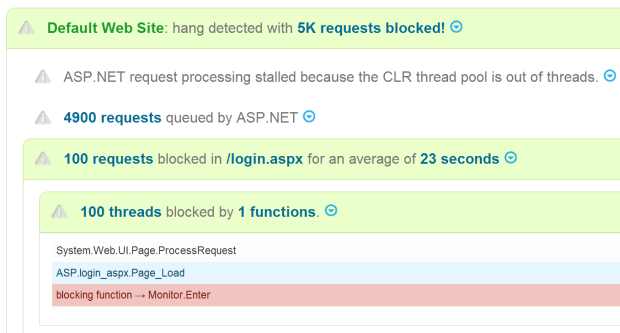
See the actual IIS & ASP.NET operation
See the actual request flow, and the key IIS & ASP.NET performance issues during the hang.
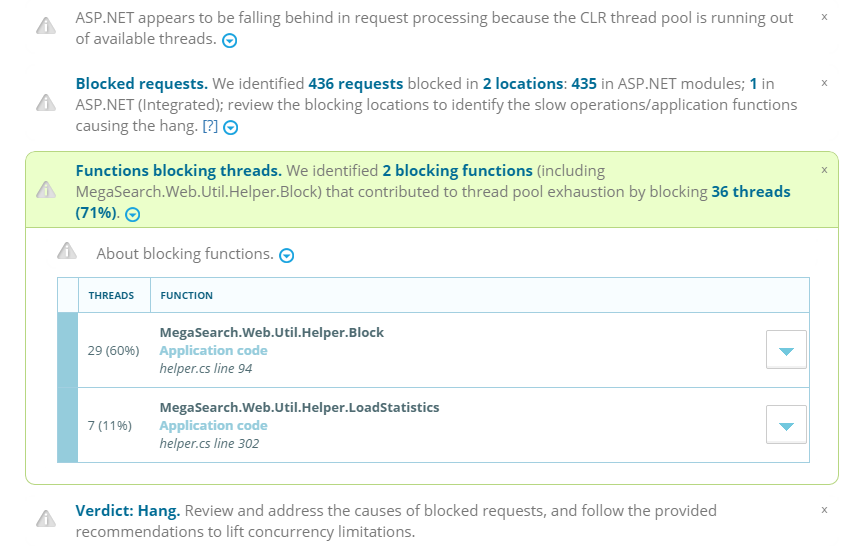
Expert guidance
LeanSentry analyzes the specific causes of the hang in your app, and gives you best practice guidance on how to address it.
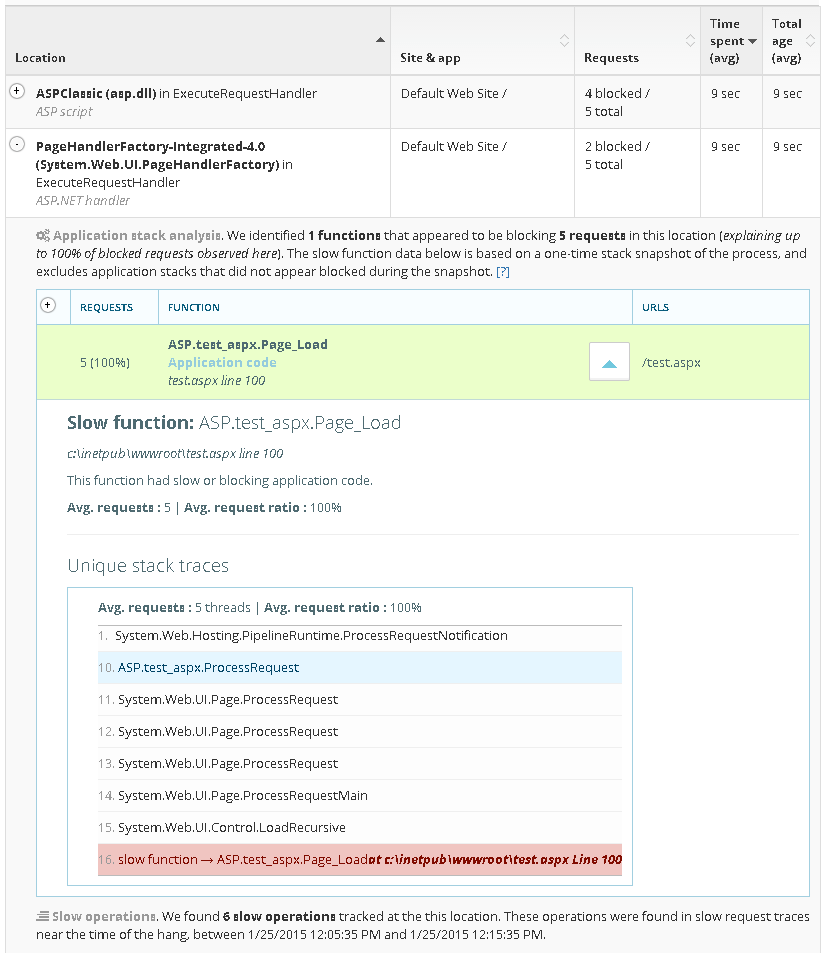
Identify the function, slow SQL, REST call causing blocking
LeanSentry automatically determines the application code causing request blocking or thread pool exhaustion, and shows your the line of code, SQL query, REST url, or file being accessed.
Try it out
If you are still troubleshooting hangs the hard way, or trying to use the generic transaction monitoring tools, you are missing out. To learn more, check out LeanSentry’s hang diagnostics, and do a trial to see it for yourself.
You may have noticed that we’ve been very quiet in the last year. The reason: as a small team, we found the initial demand for LeanSentry a bit overwhelming. This made it difficult to focus on building the kind of product we envisioned.
So, we decided to take a year to innovate our product, and deliver the kind of experience that our customers wanted.
Today, we are back with a brand new www.leansentry.com and whole new generation of our service.
What does LeanSentry do?
LeanSentry uses expert analysis techniques, many developed at Microsoft, to give you deeper insight into your web apps.
We automatically analyze IIS and ASP.NET performance, troubleshoot website hangs, tune .NET CPU and memory usage, troubleshoot errors, and much more.
The best part? It’s lightweight, cannot affect your applications, and can run alongside any existing APM or monitoring tool.
What’s different about LeanSentry?
In short, everything!
We have a brand new, real-time interface that makes it easy to access information with just a few clicks.
Our diagnostics have been upgraded to be way easier, and give you lot a lot more insight into your stack’s performance.
We have a simpler, faster deployment that lets you add LeanSentry to your production servers, Windows Azure or Amazon EC2 in less than 5 minutes, with no restarts or iisreset.
Here are some highlights for a quick glance:
Use hang diagnostics to see what causes IIS & ASP.NET performance problems in your site.
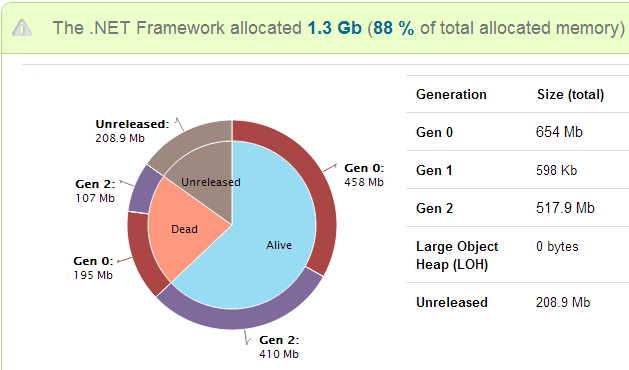
Quickly resolve memory leaks and tune the application’s memory usage.
Automatically analyze CPU usage if your website consumes high CPU.
Get code-level details to tune application CPU usage.
Identify blocking application functions that cause hangs and slow requests.
Detect most production problems and get the diagnostics to resolve them quickly.
Give me!
If you’ve tried LeanSentry a while back, you simply must see it again.
If you have not, this is a good time to check it out! Head over to www.leansentry.com and sign up for the free trial to see for yourself.
To all our customers and everyone that supported us so far, thank you! We hope the new service makes your life that much better. Stay tuned for a lot more about the new product, our story, and much more in the coming weeks!
In the last several months, we’ve worked hard to provide automatic diagnostics for most application problems on the Microsoft web platform … hangs, request queuing, errors, high CPU, and so on.
Even though LeanSentry can automatically detect and and diagnoses many of these problems, it can sometimes it can be difficult to see how they all relate … and how they impact the overall health of your web application.
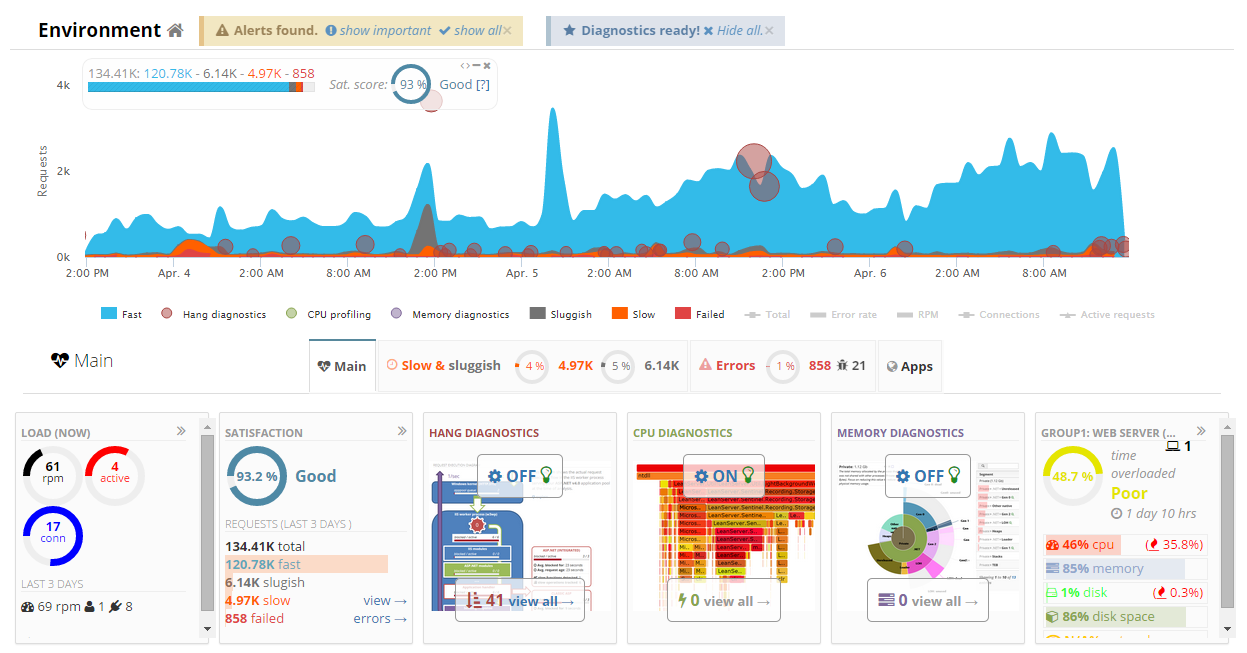
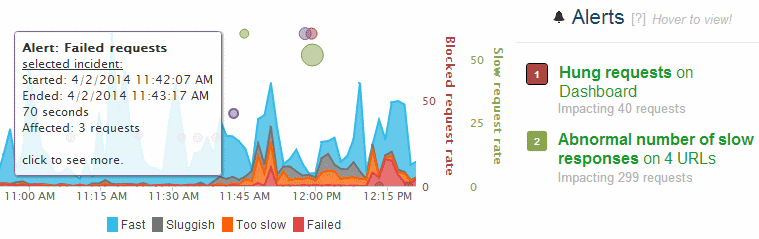
NEW: Alert layers!
Alert layers uses layers of bubbles to show you all your performance problems, and how they affect your application’s health … directly on the application’s health timeline!
With these alert “bubbles”, you can instantly see where alerts took place, how they affected your request satisfaction in that moment, and how they related to other alerts.
This can often tell a more complete story then looking at each alert in isolation.
Usage tips:
1. Hover over any alert to show it on the graph.
2. Click the alert number to make the alert “sticky” so it does not go away when you hover over another one. Click again to hide it.
3. Hover over alert bubbles to see more information.
4. Click a bubble to go to the alert page, and diagnose it!To check this out, simply log into your dashboard and pick an application.
More good stuff coming your way!
Next, we are working on improving our alert pages so they are easier to understand, and show you the problem diagnosis right away.
AppliedInnovations, a leading Windows hosting provider, announced a partnership with LeanSentry to help customers get their Windows web apps ready for the holiday rush.
It did so after getting requests from its customers who have already been finding LeanSentry incredibly helpful.
Says Mayer Kahan, owner of Osgood Textiles at www.onlinefabricstore.net:
“We are a .NET shop, troubleshooting bugs has always been a time consuming process of code review and digging through server logs.
LeanSentry finally allowed us to see in real time how our site is performing, providing a single platform for viewing our whole environment.
As a result, we improved site performance, and were able to be better informed about what is really going on with our physical environment.”
If you are an AppliedInnovations customer, it has never been a better time to try LeanSentry.
If not, you can get your trial account now at https://www.leansentry.com/. If you are running an ecommerce site on the Windows platform, this just might be a smart move for the Black Friday/Chrismas season.
This week, we have another big improvement for you.
We completely remade our Performance page, and made it a lot easier to view your website performance data.
What’s there?
Slow requests tab shows you what operations caused slow requests to your site.
Resource use tab shows you the CPU, Memory, and Network usage by the website … compare it across all servers … and give you the diagnostic data to explain what caused the usage.
As a bonus, you can enable CPU profiling, Memory diagnostics, and slow operation tracking directly from the page.
Above all, the new interface is clean and wonderfully simple.
This is available immediately in your LeanSentry account! Just log in and go to the Performance page for any of your websites.
Tasks are simple, step-by-step wizards to help you fixing ASP.NET problems.
Our users wanted a simpler way to solve common problems without finding them in the LeanSentry dashboard. And that’s exactly what we built.
Here is a video of using the “Fix slow requests” troubleshooting task to quickly troubleshoot slow page loads:
This also leverages the new slow operation tracking feature we announced last week, which tells you what causes your slow requests by tracking the operations that slow them down.
We already have tasks for:
Fix your top errors
Troubleshoot slow requests
More tasks are coming over the next couple weeks. Do you have a suggestion for a task you’d like to see? Let us know!
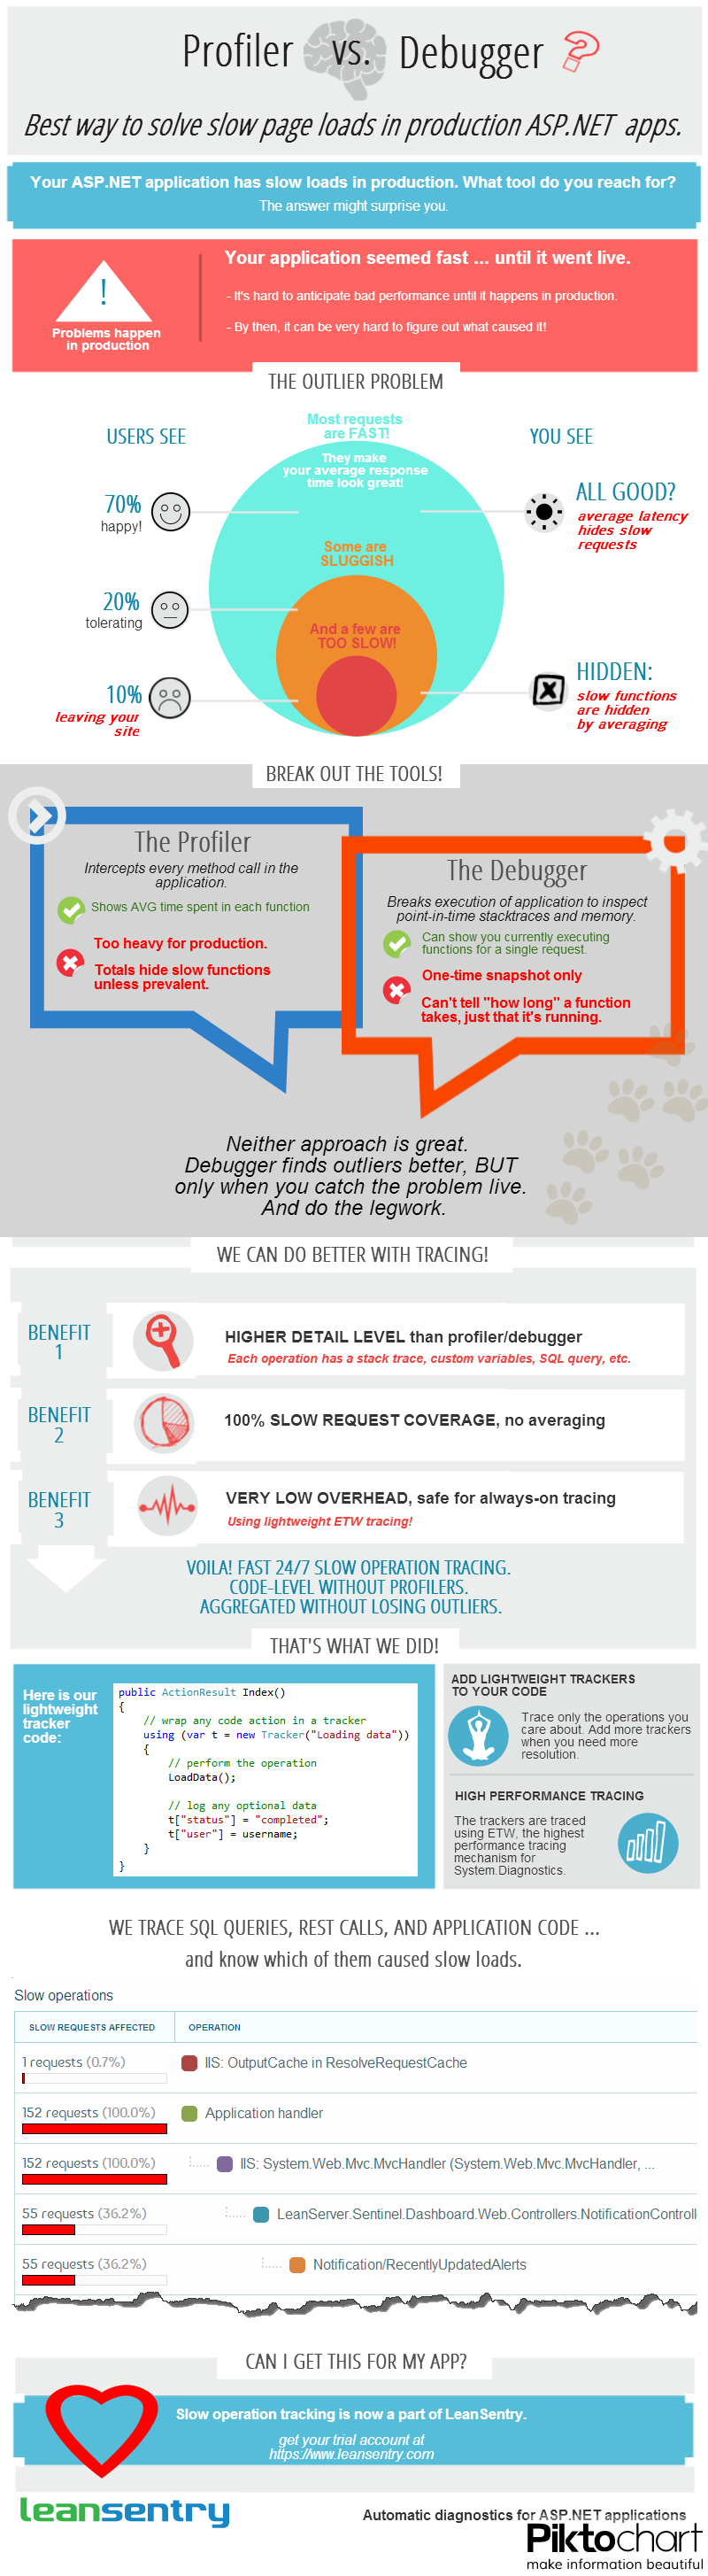
Got slow ASP.NET page loads in your application? Should you use the a profiler or a debugger to troubleshoot them?
We put together an infographic to help you decide.
It also mentions a third approach using ETW tracing, which is what we used for LeanSentry’s new slow operation tracking feature … and the benefits it has over traditional debuggers or profilers.
Using high-speed ETW tracing for 100% slow operation coverage
We just announced our new slow operation tracking feature, which uses ETW tracing to give a complete coverage of slow operations. It combines a lightweight tracing library, intelligent filtering, and very fast ETW tracing, and an awesome report in the LeanSentry dashboard.
The result: a much better way to track what causes slow page loads in ASP.NET applications than the traditional profiling or debugging approach.
Unlike a profiler, we can trace every single slow operation, as well as its stacktrace and custom application variables, without losing it to averaging.
Unlike a debugger, we can get continuous coverage of all your requests, not just the ones you happened to catch when you were debugging.
Unlike both, its fast enough for 24/7 monitoring in production and gives 100% coverage of all your slow requests.
If you think “OMG that must be so slow” when you hear tracing, think again. ETW tracing is pretty much on all the time in your applications, and is tons faster then any other custom-built tracing mechanism you may already have going on. In fact, most apps can turn on ETW tracing and probably never realize its there.
Most importantly, you decide which operations to trace! You can add more or fewer trackers to your code to get more resolution.
Of course, LeanSentry does some extra stuff under the covers to make the most of this. We know what makes a request slow (you configure per-URL response time thresholds), automatically determine which operations are slow so we don’t trace everything, and provide a near-realtime report to you.
More resources
Learn more about LeanSentry’s new operation tracking feature – based on the ETW tracing approach the infographic mentions. Check out the demo video here!
More big news today … we just announced our new pricing!
The new pricing is a result of a user survey we conducted, and the lessons we learned from it.
A big thank you to everyone who participated in the survey and shared their feedback with us.
New plans!
The new plans make LeanSentry’s automatic diagnostics more accessible, by making them available in our new Standard plan.
We also introduced our new Professional plan, which provides users with power features for tuning and troubleshooting their apps. This plan offers features like advanced diagnostics (e.g. our memory diagnostic), and the ability to search all of LeanSentry’s data and create a custom investigation with it.
The new Professional plan will enhance anyone’s ability to provide professional level application support, without spending hours analyzing server data or even having to log into the server!
We also kept an affordable Lite plan, which allows you to get many of LeanSentry’s most popular features a lower price. We include all of our basic monitoring, popular error tracking, and basic alerts at this level.
Have you wanted to use LeanSentry diagnostics in your apps but couldn’t afford it before? Check out the new Standard plan.
Are you an existing user? Not to worry, we upgraded your account to the new Standard or Professional plan automatically at no charge. Thanks for being with us!
We’ve been working hard on LeanSentry’s automatic diagnostics, to make sure it can detect and diagnose most production issues for you.
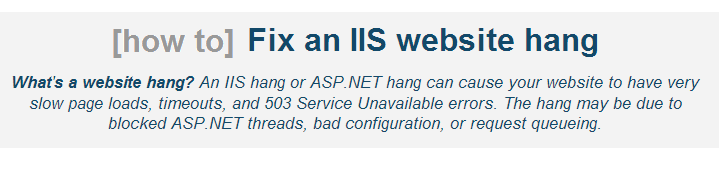
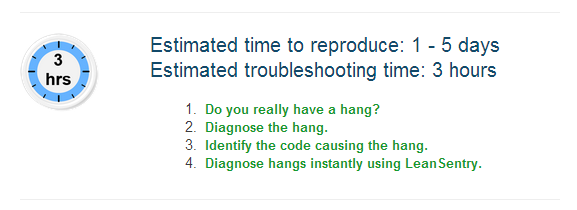
If you are not using LeanSentry yet, that means you are still doing troubleshooting by hand. To help, Mike recently created the LeanSentry Production troubleshooting course, an email course based with his own debugging techniques.
The guide gives practical tips on how to isolate, and diagnose the hang so you can fix it. All you’ll need is the standard Microsoft tools and some time.
Here is a sneak peak:
Want more IIS & ASP.NET troubleshooting guides?
If we get good feedback on the guide, we plan to turn the rest of the class into online guides for everyone to use.
It helps us raise our profile, and its an awesome way for us to contribute to the IIS & ASP.NET community.
Running production web applications is a constant struggle. Slow page loads, hangs, crashes, memory leaks.
Even when you think you are clear, they come back anytime there is a code change, new feature, new server environment, or even a change in traffic.
You can have the best monitoring system in place, but when the red light goes off … YOU still have to diagnose and fix the problem.
Conveniently, that’s where your monitoring tool politely bows out and lets you do the hard work.
And where many IT and devops teams end up spending most of their time.
At LeanSentry, we set out to fix the production troubleshooting process.
To do it, we had to solve the problem of both tools AND expertise.
Tools. The tools we use fall into two categories: production monitoring tools (perfmon, logparser, SCOM, third parties), and developer analysis tools (debuggers, profilers). The monitoring tools detect but cant diagnose problems. When you finally bring in the heavy developer tools to solve the problem, its already long gone. You can’t profile a process that doesn’t have high CPU anymore … or debug a hang that’s no longer there. The alternative: to run your process under 24/7 profiling and debugger in anticipation of possible problems is just not acceptable.
Expertise. Even if you somehow got all the data, making sense of it can be very difficult. If you’ve ever done a production hang or memory leak investigation, you know exactly how much work and time it takes to get to the bottom of things.
Of course, you could go out and hire an troubleshooting expert. Get security access for them. Spend hours explaining your application to them. Pay them a lot of money. Then, they’ll set up the same debugging tools on your server, wait for the issue to reproduce, and maybe get you the answer several weeks later.
We’ve been doing this kind of troubleshooting for years.
But to make it accessible to everyone who runs Microsoft web apps, we needed to do it automatically, with low overhead, and without requiring the user to be an IIS expert.
Here was our blueprint:
Lightweight 24/7 monitoring to always catch problems the first time. We use performance counters, IIS logs, and ETW events to watch for problems. These protocols have near-zero overhead on the server, and cannot affect the application because they completely external.
Automatically detect problems like hangs or memory leaks. These are the tricks of the trade: rules based on Microsoft guidelines and our own troubleshooting techniques. Our hang diagnostic uses over 12 different rules to reliably detect a hang given various pieces of lightweight monitoring data.
Automatically analyze the problem so you don’t have to. When the problem is detected, we’ll analyze it immediately and attempt to determine the root cause. This also works to eliminate the knowledge gap: software can do the complex analysis and present the facts simply so that operations teams can easily act or transition the resolution to the developer.To do the analysis, we can leverage multiple data sources at our disposal: including IIS logs, ETW events, profiling data, and sometimes the debugger. We’ve been doing this kind of troubleshooting for years, so this was just a matter of automating it.Best of all, this analysis has low impact because a) it only takes place when there is already a problem and b) usually lasts just a few seconds and always keeps the application running.
Alert you about the problem, and show you the solution. This is the best part. Instead of having to spend days hunting and analyzing the problem, you get a shrink-wrapped report with a pretty bow on it (bow not included). This is the difference between taking weeks to diagnose a problem every time, or literally minutes.
LeanSentry can now diagnose: website hangs, ASP.NET memory leaks, IIS application pool crashes, and more
Getting these kind of diagnostics to work right for everyone takes time. We are now 7 months after our launch in February, and here are the kinds of things we can diagnose:
Hangs and slow page loads. We’ll detect IIS website hangs or very slow page loads, and tell you when you have concurrency misconfiguration problems or thread pool exhaustion. Down to the line of code thats causing the hang. Learn more about the hang diagnostic →
IIS and ASP.NET errors, IIS application pool crashes and recycles, and more.
There is too many to list here, but you can see many of them in action in our demo application.
Our ultimate goal was to change the way people deal with application problems in production.
To break the monitor -> struggle -> reproduce -> investigate cycle.
It looks like we are finally doing it. To check out our new diagnostics and how they work, go to www.leansentry.com. While there, set up a free trial account and never look back.