Now, you can instantly find and get data for all of them!
Say what?
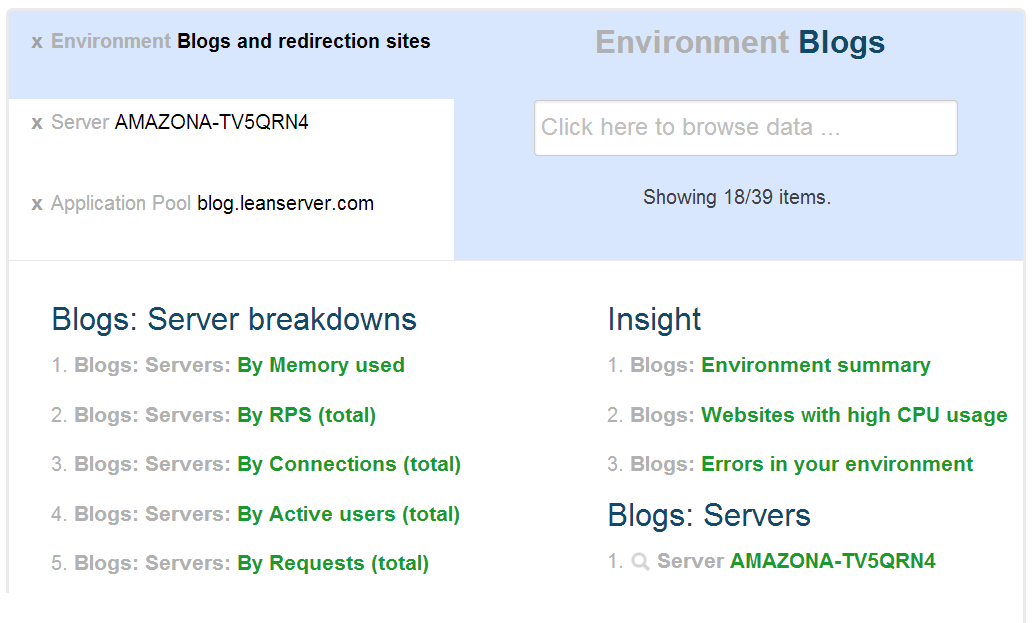
Under the covers, LeanSentry builds a graph containing all the objects its seeing in your application. For example, your environment contains servers, the servers contain processes, websites, and so on. Each website contains URLs we are extracting from your logs. URLs are associated with errors we are seeing in your application. With the new search, you can quickly browse and find any of these.
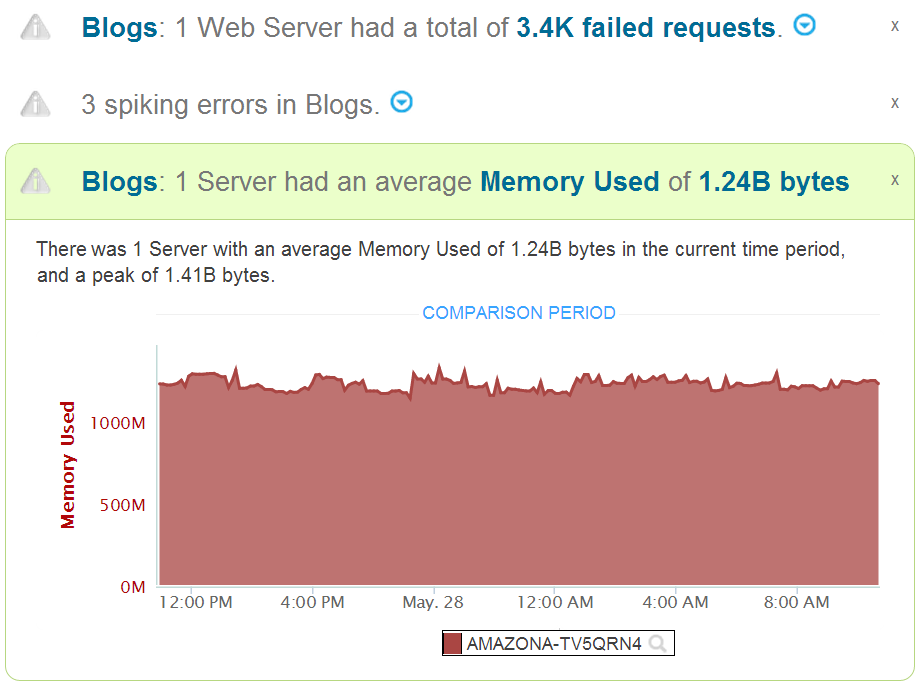
But, it gets better. LeanSentry collects a lot of metrics from your environment (e.g. performance counters), and calculates other metrics (e.g. request latency, error rates, and so on). It also generates insights (e.g. analyzing an error for abnormal behavior) and alerts (e.g. application pool crashed). You can now find and show all this data when you search your environment.
For example, you can:
1. Break down the processes by their memory usage across all your servers. Then, drill into a specific process on a specific server, and break it down by its memory usage vs. others on the server. Then see when the process was launched, by who, and what the path/command line was.
2. Search for a specific error across all your websites. Select a specific instance, show its history over time, and view its occurrences.
3. Search for a specific website, see all URLs in it broken by latency, and see what its throughput was over time.
You can answer a dozen questions like this in minutes and see all the data you found side by side.
This is how it works:
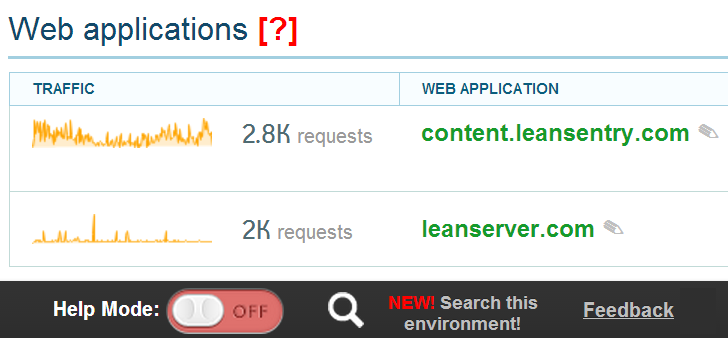
1. You can open the “search” interface by clicking the Search icon at the bottom of any page. This will open the search page, and focus it on the website, server, URL, or error that you were looking at. This way, you are always first looking at the very thing you wanted to learn more about.
2. LeanSentry will show you all the data available in the current context. Simply type to instantly filter down to the thing you want … or press enter to do a “deep search” which will search the entire data graph.
3. Click any of the data items to show it! You can quickly switch back and forth between all the objects you’ve looked at, and grab data from all of them as needed to tell the story.
With this feature, you can explore your environment, and quickly get rich information to support your investigations or performance tuning. We’ll save your search, so you can use it to create custom reports about a problem and then share it with your team.
The best part? As we add more alerts, more diagnostics, and more insights, they will immediately become available to you even if they are not yet part of the dashboard. We are making this feature a part of our Core plan so everyone using LeanSentry has access to it effective immediately 🙂
We’ve been kicking ass, and its showing. Be sure to come by our booth at TechEd 2013 next week, and see all these new features live!
If you haven’t yet, sign up for the trial and start using LeanSentry to support your IIS/ASP.NET apps like a boss.
Best,
The LeanSentry Team


