Crack down on 404 errors in IIS & ASP .NET apps

Crack down on 404 Not Found errors

404 Not Found is the most common error for most production web applications. So, its all too easy to start ignoring them after a while.

After all, you can’t do anything about pages that don’t exist in your site, right?

WRONG. Turns out, 404 errors often signal real production problems that CAN and SHOULD be fixed.

Problems like:

  • Broken links to your site that are causing you to lose potential sales or leads
  • Botched deployment / code changes that prevent your users from using your site correctly
  • Hacking activity that is wasting significant processing resources on your server

Read on to learn about the 4 common classes of 404 Not Found errors and what you should do to find and fix them.

LeanSentry tracks every single IIS and ASP.NET error for thousands of websites, and 404 Not Found is always at the top of the list. In fact, being able to ignore 404 errors has been a top LeanSentry feature request.

We’ve done a lot of work to help people track and fix production errors: grouping related errors, highlighting important errors, and letting the user quickly filter down to the errors they care about. While we dont advocate ignoring errors outright, we are also adding a feature to let you prioritize/hide specific errors for an app or just for a specific server / url.

The 4 classes of 404 errors you probably want to fix

Here are 4 key classes of 404 Not Found errors that require further attention, and how you can fix them:

1. Broken links to your site

Broken links to your site cause you to lose valuable leads, and frustrate your users. In some cases, bad links from major referral sources can cause you to lose a large percentage of your traffic.

How to find it

Look for 404 errors that request URLs that appear to “belong” to your site, e.g. following your site’s URL hierarchy or mispelling known versions of your urls.

How to fix it

Break the 404 errors by URL, and by HTTP Referer. You should be able to identify groups of specific content and referring sites that have the broken links.

NOTE: You need to turn on “Referer” field in your IIS logs to do this. It is unfortunately NOT enabled by default.

If the referrer is your own site, you can fix your own links. If the referrer is a third party site, you can contact them to get their links fixed.

2. Missing content, due to bad deployment or site changes

Bad deployments of your site content can cause some of your important content to become unavailable. Site changes often cause the same problem, esp. when URL rewriting or dynamic routing is involved.

How to find it

Look for 404 errors for URLs that previously worked.

How to fix it

You’ll need to diagnose the cause of the 404 error. This can be hard, since there can be many IIS and ASP.NET problems that lead to 404s (we’ll write another blog post about how to diagnose 404s comprehensively). Here are the top things to check:

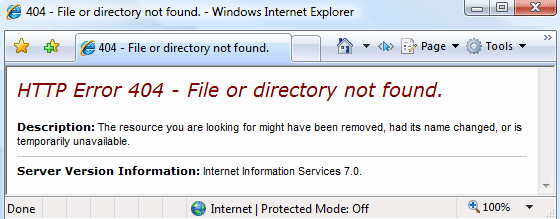
1. Try to reproduce the 404 not found error yourself. Request the URL, if it returns a 404, great! You can now troubleshoot the error to figure out why. Be sure to use the detailed error page to confirm what physical file is being requested, and make sure it actually exists on the server.

2. Set up Failed Request Tracing to capture the 404 error trace. In the resulting traces, you should have all the details you need – the requested URL, phsysical resource it mapped to, the associated handler, and the error details.

3. Server routing errors

The server routing errors are becoming a more common problem, since many IIS/ASP.NET applications use SEO-friendly extensionless URLs, and code-determined routing (like ASP.NET MVC routing). A common time for these is a new code deployment or deployed to a new server, which can break both the configuration needed for routing and the code routing rules.

The process for finding and fixing this is similar to #2. However, a more detailed investigation may be required to understand why the routes are not working. The Failed Request Trace of the request may be a good start since it can trace URL Rewriter rule matching, and handler mapping done as part of routing. Also see this post for debugging ASP.NET MVC routing problems.

4. Hacking attempts

Many 404 errors are the result of hacking or bots scanning your website for vulnerabilities. I am sure everyone with a production website has seen the ubiquitous requests to “php_myadmin” even if they don’t have any PHP content.

You may want to dismiss these errors as “nothing you can do”. However, consider the following before moving on:

1. Requests to missing content can add significant processing overhead to your server. For example, they can cause worker processes to be started and ASP.NET applications to be loaded into memory / performing expensive initialization (this can be a big problem for servers that host many inactive applications).

2. Hacker requests failing with 404 not found errors may be a precursor to successful hacking attempts. You may want to stop them before its too late.

How to find it

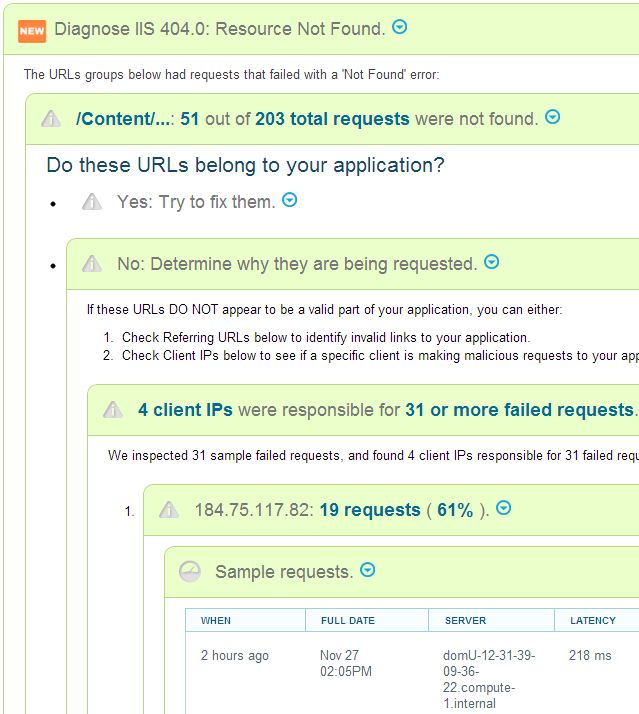
Break down your 404 errors by URL, and look for URLs that do not appear to be a legitimate part of your application. Specifically, look for URLs that have never been successfully requested.

Then, break down the 404 errors by client IP, by HTTP referer, and by User Agent. You will often be able to spot traffic from specific clients, or specific user agents, and this traffic will almost never have the HTTP referer set (be careful with jumping to conclusons if you dont have HTTP referer logging enabled).

How to fix it

To eliminate the impact of the traffic on your server, and to prevent hacking attempts, block the traffic you identify as malicious. Here are the top ideas:

1. Deny access to folders with authorization rules.

    <location path="wp-cron.php">
        <system.webServer>
            <security>
                <authorization>
                    <clear />
                    <add accessType="Deny" users="*" />
                </authorization>
            </security>
        </system.webServer>
     </location>

2. Implement IP blocking. You can use the IIS IP Restrictions feature, or the new Dynamic IP Restrictions feature.

Be proactive about monitoring and fixing errors

The best way to keep your website healthy is to watch the errors you have in production. Any time you see an increase in errors, or an increase in a specific error, you should investigate to see if there is a problem that can be fixed. By contrast, not watching errors or hoping that they will go away is a quick way to lose sales and frustrate your users.

Users don’t complain, they just leave. This was a lesson we learned early on after launching LeanSentry. After our initial launch, we had a ton of errors due to load problems with our backend. Once in a while, a user complained about the errors, and we fixed them.

However, eventually we realized that many users were just getting frustrated and leaving the site, without ever telling us about it.

So, we implemented a proactive strategy where we watched every single error, and followed up with every user that ever hit one. This helped us understand the true scale of the problems, fix them, and make sure that we stopped frustrated users from leaving.

LeanSentry is one great way to keep tabs on production errors in your IIS/ASP.NET applications. It tracks every single error, and groups related errors to give you an accurate history of how often the error happens.

What’s more, LeanSentry also solves the problem of troubleshooting the error, by capturing all the details you or your developers need to fix the error. Including ASP.NET exception callstacks, detailed request traces, and more.

LeanSentry tracks down all 404 errors, and walks you through the troubleshooting steps to fix them
LeanSentry tracks down all 404 errors, and walks you through the troubleshooting steps to fix them.

To see how LeanSentry error tracking helps you get a handle on production errors, pop over to www.leansentry.com and check out the live demo! Then set up the free trial and never look back.

LeanSentry: TechEd 2013 is done!

Last week, we attended TechEd 2013 in New Orleans, and showed off LeanSentry to a crowd of Microsoft IT folks and developers. The reception was awesome! It took us a week to recover after the conference, but here is the wrapup.

Biggest take-away: everyone who runs Microsoft web apps wanted a tool like LeanSentry.

IT operation engineers, administrators, and developers all felt the pain of production troubleshooting, and wanted something that can help them diagnose production problems faster.

We spoke to hundreds of people, and asked almost everyone whether they’ve ever had to troubleshot a website hang or crash in production. Most of the time, the answer was “yes”.

We then asked, did you enjoy it? 100% of the time, the answer was “Hell no”! People told us dozens of stories of trying to catch a hang in production, and how long it took to figure out the root cause, even when Microsoft support was involved.

Then we got to hear the classic story of finger-pointing between the IT administrator that runs the production environment, and the developers that build the application. Often, the operations team didn’t have enough evidence to convince the developer that the issue was in their code … And the developer didn’t have enough information from production to reproduce the issue in the test environment.

We then showed LeanSentry’s automatic IIS/ASPNET hang diagnostics, which automatically detects hangs and instantly identifies their root cause, including blocking IIS modules, CLR threadpool exhaustion, or application code. People loved it!

The highlights

The feedback we got was pretty consistent. Everyone’s favorite things were:

1. Automatically diagnosing IIS and ASP.NET problems in production. Many people couldn’t believe that we do this at first. Many times we had to explain our Windows Server background and that Microsoft web platform development is all we do. Of course, seeing the hang diagnostic demo also helped.

2. Lightweight monitoring without profilers. IT administrators really appreciated the fact that LeanSentry uses lightweight Windows protocols like Performance counters and IIS logs to monitor the server, instead of loading application profilers. Many said “we dont want the performance monitoring tool to become the performance problem”, as we often hear from users of profiler based tools.

Many also loved how LeanSentry can be sandboxed to a separate VM, and monitor the production servers without installing anything on them. No reboots, iisresets, etc.

3. Making everything simpler. IT managers that handled web operations loved how simple the LeanSentry dashboard was, and how it was very easy to see all the requests, errors, and performance data in one place. Developers also loved aggregating the errors across Windows Server, IIS, and ASP.NET and getting all the details needed to troubleshoot the error. We heard a lot of complaints about how complicated SCOM was, and how LeanSentry dashboard was the “anti-SCOM”. The consensus was that LeanSentry complements environments that use SCOM, by providing a much simpler view to track problems and get the details to resolve them.

4. Working directly with the developer team. People loved talking directly with the founders and the developer team. Many were used to dealing with company sales people at the other booths. We loved showing everyone the Olark chat box on our site, where you can talk directly to the dev team anytime.

Top questions

The top questions people asked were:

1. How do you diagnose hangs in a lightweight way? We explained our multi-stage process for diagnosing hangs that insures lightweight monitoring, and still provides debug-level resolution for hangs. We use similar approaches for diagnosing other problems, where we first detect many potential symptoms of a problem using lightweight monitoring like performance counters, and only perform the intensive diagnostic once we know the problem already exists.

2. How is LeanSentry different from SCOM/AviCode/New Relic? In many ways! We put together a page to explain what makes LeanSentry different.

3. Can I host LeanSentry in my environment? You can’t just yet, but you will be able to later this year! We now have a beta program for people who want to help us do this. Email us for more info!

The goodies: TechEd discount, LeanSentry Robot t-shirts

For everyone who came to talk to with at TechEd, we are offering a special TechEd discount for our “Full service” plan. This is a limited time discount, so email us for details if you are looking to activate your account this month.

Also, we had a huge level of interest in the LeanSentry t-shirts. Because of this, we ran out early on the first day. If you didnt get a shirt, be sure to email us and we’ll put you on the list to get one!

Thanks and more

Thanks to everyone who came out to support us, and who talked to us at TechEd! We had a great time thanks to you, and really appreciate your support.

If you talked to us at TechEd, be sure to reach out over the next couple weeks to get the discount. You can also schedule a deep-dive demo with us to see how LeanSentry can improve your production operations.

If not, get in touch with us anyway! You can also give LeanSentry a try yourself. We are always just an IM away!

Best,
The LeanSentry Team

LeanSentry at TechEd 2013: Day 1

TechEd is awesome! Its our first major conference, and so far the reception has been great. You can really tell that LeanSentry is addressing a major pain point for pretty much everyone running the IIS/ASP.NET application stack.

TechEd is definitely more of an enterprise crowd, with attendees ranging from midsize companies to the likes of Deloitte and Verizon. However, they face many of the same problems that we see in small businesses and startups. Turns out production troubleshooting is a great equalizer 🙂

The LeanSentry TechEd booth

Things you loved!

It’s been great to get some face-to-face feedback about LeanSentry. Here are a few of the highlights that everyone absolutely loved:

1. IIS hang and crash diagnostics. This was literally jaw-dropping for some. We asked if debugging hangs in production was a problem, and you could just see the pain in people’s eyes. The best response we got was “Its the difference between a good day and a bad day”.

People just could not believe that LeanSentry could diagnose a hang automatically, and get them right to the source of the hang in a few clicks.

2. Lightweight monitoring, with no profilers / nothing to install on the production servers. This was a huge hit. It was clear that you appreciated non-intrusive monitoring that doesnt slow down your applications with a profiler.

And of course, everyone loved the LeanSentry Robot! We’ve had attendees say that it was the best t-shirt at the conference. If you didn’t get the shirt at the booth, email us and we may be able to mail you one.

Things you wanted

We’ve also gotten a good sense for what people want to see from LeanSentry. The big one was a self-hosted version of LeanSentry that can be deployed in environments compliant with PCI, HIPAA, and defense contractor requirements. We heard you loud and clear on that, and we can say that a version of self-hosted LeanSentry is in the works.

If you want to use the self-hosted version of LeanSentry, email us and we can discuss the timeframe further.

TechEd continues, so if you are there be sure to come by booth 2417 today and check us out.

You can also see all of our new features live in our demo app. See it here and sign up for the free trial!

Best,
The LeanSentry Team

Search your entire IIS/ASP.NET web application stack

Browse all the data in LeanSentry! Filter down to dozens of IIS and ASP.NET metrics, insights, and alerts.

LeanSentry tracks all the important things that make up your Windows web application environment … including processes, Windows services, ASP.NET websites, IIS application pools, URLs, errors, etc.

Now, you can instantly find and get data for all of them!

Say what?

Under the covers, LeanSentry builds a graph containing all the objects its seeing in your application.  For example, your environment contains servers, the servers contain processes, websites, and so on.  Each website contains URLs we are extracting from your logs.  URLs are associated with errors we are seeing in your application. With the new search, you can quickly browse and find any of these.

But, it gets better. LeanSentry collects a lot of metrics from your environment (e.g. performance counters), and calculates other metrics (e.g. request latency, error rates, and so on).  It also generates insights (e.g. analyzing an error for abnormal behavior) and alerts (e.g. application pool crashed).  You can now find and show all this data when you search your environment.

For example, you can:

1. Break down the processes by their memory usage across all your servers. Then, drill into a specific process on a specific server, and break it down by its memory usage vs. others on the server. Then see  when the process was launched, by who, and what the path/command line was.

2. Search for a specific error across all your websites.  Select a specific instance, show its history over time, and view its occurrences.

3. Search for a specific website, see all URLs in it broken by latency, and see what its throughput was over time.

You can answer a dozen questions like this in minutes and see all the data you found side by side.

This is how it works:

1. You can open the “search” interface by clicking the Search icon at the bottom of any page.  This will open the search page, and focus it on the website, server, URL, or error that you were looking at. This way, you are always first looking at the very thing you wanted to learn more about.

Search any website, server, process, URL, or error!


2. LeanSentry will show you all the data available in the current context.
 Simply type to instantly filter down to the thing you want … or press enter to do a “deep search” which will search the entire data graph.

Browse all the data in LeanSentry! Filter down to dozens of metrics, insights, and alerts.


3. Click any of the data items to show it!
You can quickly switch back and forth between all the objects you’ve looked at, and grab data from all of them as needed to tell the story.

Grab metrics, insights, breakdowns, and more from any object and view them side by side!

With this feature, you can explore your environment, and quickly get rich information to support your investigations or performance tuning.  We’ll save your search, so you can use it to create custom reports about a problem and then share it with your team.

The best part? As we add more alerts, more diagnostics, and more insights, they will immediately become available to you even if they are not yet part of the dashboard. We are making this feature a part of our Core plan so everyone using LeanSentry has access to it effective immediately 🙂

We’ve been kicking ass, and its showing. Be sure to come by our booth at TechEd 2013 next week, and see all these new features live!

If you haven’t yet, sign up for the trial and start using LeanSentry to support your IIS/ASP.NET apps like a boss.

Best,

The LeanSentry Team


The holy grail: Automatically diagnose IIS & ASP.NET website hangs

It’s your peak traffic hour, and your website is not loading. Requests are timing out, and recycling the application pool isn’t helping this time.
We’ve all been there, and it’s a nightmare even for a seasoned IIS/ASP.NET pro.

Website hangs are an unfortunate but common reality for web applications. To make things worse, even the latest and greatest performance monitoring products don’t help. After 10 years in this business, we don’t know a single commercial or MSFT tool that can figure out what causes a hang in an IIS / ASP.NET application (more on why later). So, this is where the seasoned pro reaches for the hardcore tools, the WinDbg debugger or Debug Diagnostics … and mentally prepares to spend hours digging around.
That is, if they are are lucky enough to catch the problem live on a machine with the debugger installed.

And what if you don’t make a living debugging IIS? Call Microsoft support and get ready to spend 15 hours on the phone before you can get someone who even knows what a w3wp dump is. We’ve had difficult hangs take 2 months to resolve, between catching and collecting proper evidence for a hang in production, and waiting for MSFT support to escalate to an engineer that knows what they are doing.

It’s no wonder that it took us this long to finally tackle this scenario with LeanSentry. There are just so many things that can go wrong: hanging SQL or web service calls, application deadlocks, thread pool exhaustion (in both the IIS and CLR threadpools), CPU overload, the list just goes on. Most of the time, many of these things cascade together to cause the hang.

That said, we finally did it.
LeanSentry is now the only monitoring tool available that automatically troubleshoots IIS/ASP.NET hangs.

This is how it works:

1. Your website encounters a hang for one out of dozen possible reasons.

2. LeanSentry automatically detects the hang, performs a realtime diagnostic test, and sends you an alert that tells you exactly what caused the hang.

This makes sure that we capture the hang no matter when, how rarely, or on what server the hang happened. LeanSentry then tries to cut through the complexity of the hang analysis, and explain what happened in plain language so you can quickly understand and take action to resolve it.

LeanSentry automatically diagnoses an IIS/ASP.NET hang

LeanSentry breaks down a hang simply: ASP.NET fell behind in request processing with 4900 requests in the queue, because it ran out of threads in the CLR threadpool. The 100 threads available were blocked waiting for the 100 requests that got stuck in Page_Load() in login.aspx.

Sounds too good to be true, right? We thought so too when we finally got it to work. Here is what happens in more detail:

1. Realtime hang detection without debuggers. LeanSentry continuously monitors each application pool for signs of hangs, to make sure that we catch it whenever it happens. This is done using LeanSentry’s standard lightweight monitoring, which has virtually 0 impact on your production systems, unlike running your applications with a debugger or profiler attached. This also means it can even be done remotely without installing anything on your actual production servers.
When detecting a hang, we take into account the application pool’s specific IIS/ASP.NET threading settings that affect request processing, as well as many other known symptoms of hangs. For example, Max Queued Item Age of the application pool queue stably increasing for over 30 seconds. We can’t trust all signs though, so we look at multiple signs together and pick those that most likely indicate hangs or serious perf degradation.

2. Confirm the hang. When a hang is suspected, LeanSentry will snapshot currently executing requests and identify which requests appear queued, or blocked. For example, blocked requests have been executing in the same place for over 10 seconds. Queued requests are hard to identify and require us to use a bunch of heuristics.

3. Determine application functions that are causing blocking. If the executing requests confirm the hang, the LeanSentry Agent will perform a differential thread snapshot of the process, which will determine where threads are stuck in your application code.

4. Diagnose thread pool exhaustion. Finally, we will analyze threading and queueing characteristics of the application pool across the HTTP.SYS kernel queue, IIS, and ASP.NET, and figure out where exhaustion is taking place.

5. Generate the alert. The “Website had hung requests” alert will be generated, you’ll get an email, and can view the alert page for a step-by-step hang diagnosis.

Why aren’t there any other commercial tools that diagnose IIS/ASP.NET hangs?

Because its very hard to do. Don’t believe me? Try to follow the explanation of how ASP.NET thread pool behaves between Integrated and Classic mode across .NET 3.5. 3.5 SP1, and 4.0. It will make your brain sad. To make things even worse, recent versions of ASP.NET broke a lot of the more obscure but documented queueing functionality (MaxConcurrentRequestsPerCPU = 0 no longer works by default, and the “ASP.NET ApplicationsRequests Executing” counter erroneously shows “total requests served” instead). This shows that even the product teams at Microsoft are not closely following this area of the platform.
The only MSFT tool that even tries to diagnose hangs is the Debug Diagnostics tool, which is not suitable for continuous production monitoring and only diagnoses a small subset of issues that cause hangs. The tool itself is showing its age, having been built internally in Microsoft for pre-.NET applications and only recently adding very partial support for .NET. In most of today’s applications, hangs involve .NET applications and the .NET CLR thread pool.
Third party profiler-based APM tools that support the Microsoft platform, like New Relic or AppDynamics, lack the Windows and IIS-specific intelligence needed to diagnose these problems. They may help you pinpoint slow code (but usually not during a hang because requests never complete), but will not be able to understand what happens under the covers of IIS/ASP.NET runtimes that triggers the hang. These tools also come with the overhead of running your production applications under a profiler, which has a heavier overhead than most people are willing to allow.

Getting it done

The step-by-step Hang diagnosis will walk you through the hang as it happened, showing you where requests are blocked up to the application function, and even the HTTP request or SQL query it was making.

The diagnosis will also determine if IIS/ASP.NET threading configurations are causing the problem, and recommend adjustments for the workload.

Keep in mind, because LeanSentry performs hang detection and diagnosis in realtime, you can watch how changes in your configuration and code cause hang-type problems over time, and get up-to-date recommendations on how to avoid them. This is very different from hiring an IIS expert or Microsoft to diagnose a hang for you, because you’ll at best get the resolution for the point in time problem – which may or may not help you the next time.

The automatic hang diagnostics is one of the best examples of how LeanSentry improves your experience of running Microsoft web apps, by combining lightweight 24×7 monitoring with expert analysis based on 10 years of solving these problems for hundreds of companies. You need both: to catch the problem in production, and to make sure you can make heads or tails of it later.

Think of LeanSentry as your resident IIS expert – one that never sleeps, and costs pennies compared to what it costs to hire comparable experts from the outside. If you haven’t tried it already, sign up for the trial, and take control over hangs and other production problems with LeanSentry’s automated production diagnostics.

Come support us at TechEd 2013 and get awesome stuff!

Are you going to TechEd 2013? So are we! Be sure to come by our booth
(#2417), try LeanSentry for yourself, and chat with our founder/dev team members.

To make things even better, we are announcing two awesome promotions:

Awesome promotion #1: Help us get the word out about LeanSentry, and walk away with a Microsoft Surface!

Want to help us get the word out about LeanSentry at TechEd? Come by our booth on the first day of the conference, and pick up our snazzy LeanSentry Robot tshirt to wear on the conference floor.

Each day you come by our booth wearing the shirt, we’ll enter you into our raffle to win one or more of our demo Microsoft Surface RTs! We’ll pick a winner on the last day of the conference and you can walk away with the a brand new Surface right then and there. We don’t have a lot of shirts, so your odds to win are pretty good 🙂 Just be sure to reserve your shirt here.

Awesome promotion #2: Come by our booth, and get an exclusive TechEd-only LeanSentry discount!

If you go to TechEd, we know that you are serious about growing and becoming better at running your Microsoft apps. One of the best ways to do that is to use LeanSentry – which is built to make you an expert at troubleshooting and tuning your web apps.

We want to help people discover how much of a difference using LeanSentry can make – so we will be giving away a HUGE one-time only discount at the conference to help you get started with LeanSentry.

We’ll announce the discount details in the week before the conference. Quantities will be limited, so make sure to register early.


We are super excited to meet everyone and show off LeanSentry at the conference. Be sure to come by and take advantage of these two promotions, get details here. We’ll see you at TechEd!

Best,
The LeanSentry team

Manage your IIS/ASP.NET web apps better with smart alerts

LeanSentry’s mission is to make you an expert on the Microsoft web stack … and help you catch & solve everyday application problems without spending hours troubleshooting.  Last month, we worked hard to roll out several new features that do exactly that!

If you are running web applications on the Microsoft web platform, definitely give LeanSentry a try.  Check out the live demo and try it free in your app.

Here are some of the new things you get:

1. Smarter alerts (like you’ve always wanted!)

Most monitoring tools have alerts to notify you when problems happen, so you can respond and fix them. Unfortunately, most tools we’ve used have the same challenges when it comes to alerts: they make you work to create custom alert thresholds, then swarm you with alerts for things you don’t care about, or worse yet, miss important problems.  The signal to noise ratio is so hard to get right, and causes alerts to lose their value and just get ignored.

So, we built a better alert system: one that acts more like a human performance expert that you hired to watch your servers and apps for you. This expert respects your time and only tells you about things it knows are important to you.

Get only the alerts you care about!

Each LeanSentry alert is custom designed by us to highlight an interesting condition, such as a server being overloaded to a point of bad performance.  Each alert also automatically determines whether its important enough to be sent to you.  For example, a High CPU alert will only be important if happens on a server you consider important, or if the CPU usage is statistically abnormal high given prior history on that server.  High CPU by itself is not considered important if the server usually exhibits that behavior (we run our system in the cloud, and we are happy when our cloud instances are well utilized as long as they dont perform poorly).

This way, while you can easily see and diagnose all High CPU alerts in the dashboard, you will only get an email whenever a High CPU alert really demands your attention.

When you log into the dashboard to view an alert, we’ll show you its entire history across all the affected servers/urls/etc. Then, we’ll automatically identify the root causes of the problem, (e.g. identifying the errors for failed requests on a URL, or the specific processes, services, websites, and even functions that consumed CPU for the High CPU alert):

See the alert and its causes, aggregated over time, servers, and urls!

With 1 email and 3 clicks, you’ll see only the alerts you care about, get the entire picture, and identify the exact root causes. Done!

2. Important errors, automatically identified.

Most apps have a lot of errors. Some errors happen a lot (404 on favico.ico), but are not really interesting. Other errors happen rarely, but are very interesting (IIS worker process crash). Its very time consuming to wade through all the errors in the app to find the ones that are important enough to investigate.

LeanSentry now will automatically flag errors you should take a look at, in a daily email report as well as whenever you look at the error page. Flagged errors include spiking errors, errors that are new for the application or on a specific URL, errors that have high impact, and so on:

Highlight interesting errors!

3. Server groups, and server overload diagnostics.

LeanSentry now allows you track server performance as a group, and quickly diagnose server overload that leads to bad performance.

When you click a server, you can see a detailed breakdown of all its resources (CPU, RAM, Disk, Network), and whether the server is bottlenecking on any of them:

See server resources at a glanceSee the server resource bottlenecks!

Then, select a resource and we’ll tell you exactly who caused the overload – including your processes, services, and websites on your server.

And more good stuff

If that wasnt enough, we also released a number of other things that make your job easier:

  1. Multiple user accounts and sharing. Create accounts for your team members and share links for guest access.
  2. Better URL folding. Automatically group URLs into meaningful groups.
  3. ASP error support. Expose detailed error messages (with line numbers) for Classic ASP errors.

If you are running ASP.NET or any web application on IIS, you gotta start using LeanSentry! You’ll be amazed with how much time you’ll save, how much insight you’ll gain, and how much easier it will be to keep your web applications running.

Also, right now is a great time to become an early adopter. Whenever you want, you can chat directly with the founders and the development team, and give us feedback that might just end up in the next build.

To get started, check out the live demo and set up LeanSentry out in your apps now (it only takes a few minutes)!

Best,

The LeanSentry Team